Download here
Acknowledgements
This report is an output of the Australian Community Sector Study 2022, commissioned by the Australian Council of Social Service and the State and Territory Councils of Social Service. We warmly thank the community sector staff who participated in the Australian Community Sector Survey, and generously shared their experience and insight. We thank Rob Sturrock and Penny Dorsch from ACOSS, and the ACSS Steering Group for thoughtful guidance throughout, along with Dani Previtera from ACOSS and Isabella Nahon from ACOSS/UNSW for assistance with promotion of the survey.
© ACOSS 2023
Suggested citation:
Cortis, N. and Blaxland, M. (2023). At the Precipice: Australia’s Community Sector through the Cost-of-living Crisis. ACOSS, Sydney.
Foreword
Last December, we released our first report from the 2022 Australian Community Sector Survey (ACSS). One particular quote from a CEO running child and youth services in Victoria, struck me:
“In almost thirty years in community service provision, I have never experienced a more challenging environment.“
What that report showed in clear and distressing detail is the fact that people in Australia living in poverty, disadvantage and hardship are sinking fast and struggling to find sufficient help. We know all too well now that they are the worst affected by our current economic, social and environmental conditions. They struggle to live on an immorally low level of income support. Beneath the poverty line, they daily sacrifice at least one of food, medicines, electricity, heat, cooling and other life essentials. They consider living in tents, or caravan parks, because there are no vacant and affordable rental properties, and social housing wait lists now run into the decades. They cannot afford to leave locations battered by regular, severe disasters and remain at risk of further catastrophe. Some choose not to leave conflict-fuelled or violent homes because of their situation. They survive with a sense of deep despair, knowing government could dramatically change their situation overnight, if it wished. People on the lowest incomes are some of our country’s most resilient and resourceful people, squeezing every cent in their bank accounts in ways most people would not imagine.
One section of our country has always seen these experiences, the community sector. The pandemic highlighted how crucial community services are to our way of life. Community organisations were there first during the catastrophic 2019/20 bushfires to help communities rebuild and recover, and again and again during the series of devastating floods over the past several years. As inflation now surges, housing options dwindle and disasters become a year-round challenge, the community sector is first there again, offering support, looking for solutions and bringing dignity, respect and trust to people too often overlooked by government and others.
The findings and insights captured in this latest report, from the 2022 ACSS demonstrate a new level of exhaustion unseen in the sector’s recent work. Our systems are buckling and our workforce is breaking. To survive over the past ten years, the community sector has exhausted almost every efficiency, innovation and alternative it can muster to make the most of limited funding; funding which has often lost its real value over the life of successive contracts with government. Everyone, including senior leaders and frontline staff, work longer and harder. Four years of rolling disasters has only exacerbated these trends.
Now, some organisations, and many staff, are financially strained from cost-of-living pressures, with workers themselves personally impacted by disasters or the housing crisis and left with few alternatives but to consider leaving the sector altogether. Captured in this report are troubling stories from so many sector workers. One respondent said:
“I could leave my role and work at Coles as a Bakery Manager and receive a higher salary than I do in my current role. I also was offered a role to work with young people and families post suicide intervention work and would be paid less than a Coles casual employee completing online shopping.”
The above quote is the result of governments exhausting the goodwill, dedication and commitment of the community sector. People working in social services, nearing burnout from overwork and underpay, consider leaving the profession altogether despite their passion for the mission and the work. This in turn means less support available for those in our communities who have the least, resulting in less connection, less empowerment and more isolation and despair. And the starvation cycle continues.
The incoming Albanese Federal Government made solid election commitments to strengthen the community sector, including on funding, contracts and improved respect for our services and expertise. Its supplementary funding measure from the October 2022 Budget was widely welcomed and is now being administered. Survey respondents have pointed to slightly improved contract lengths with government. The government also acted to remove or nullify advocacy gag clauses in Commonwealth contracts. For their first year in office, these are positive initial steps to ensure the sector does not collapse.
The Federal Government must now fearlessly confront the structural challenges facing the community sector; challenges that have been growing for almost ten years, and which now lead staff to consider whether it would be better to work as a casual in a supermarket than continue to assist people in need to rebuild their lives. It has several policy consultation processes underway in major departments that may prove to be game changers for the sector in terms of funding and improved conditions for the workforce. Yet it also promotes the notion that philanthropy, volunteers and local place-based pilot projects can fill the chasm captured in this report.
Undoubtedly it is a time for serious, bold action to properly back the community sector and value it fairly, and honour election commitments made. The Federal Government has made much of its commitment to gender equality. The community sector is still overwhelmingly a workforce of women, with too many overworked and undervalued. This situation too must be forthrightly addressed.
To deliver on its promises, the Federal Government needs to be paying the full cost of service delivery, ensuring that grants to providers keep pace with real cost increases over time. That something as fundamental as this, an ordinary part of business for other industries working with the Federal Government, could be considered a game changer, is truly incredible.
The government will also rely heavily on the community sector for its jobs and skills policy agenda. Community services work is both one of the fastest-growing areas of the labour market with rising vacancies and has one of the highest rates of employment of women. Any chance the government has of reducing the gender pay gap, creating more flexible and supported workplace arrangements and improving pay and conditions for working women will necessitate significant, and long overdue investment in our workforce.
Our survey will continue to serve as a health check on the state of community services. If in another 12 months the figures are as bad or worse as this year, we will know that government inaction was almost certainly the deciding factor.
Recommendations
That the Federal Government:
- Fund the full cost of service delivery, including infrastructure, management, workforce development and administration costs in all Commonwealth grants and contracts for community services.
- Apply equitable and transparent indexation to all grants and contracts for community sector organisations, that reflects the actual increase in costs incurred by funded organisations. Ensure providers are notified in a timely manner and rates are published annually.
- Undertake a comprehensive service needs analysis to better understand community need for services, drivers behind changing need and gaps in the funding of service delivery. This analysis should inform investment decisions made by government.
- Guarantee necessary funding for pay decisions made by the Fair Work Commission affecting the community sector. Pay and conditions for the community sector should be improving with the introduction of industrial relations changes at the end of this year. As the main purchaser of services, the Federal Government must guarantee it will fund any relevant pay rises and improved workplace conditions for the community sector workforce arising from decisions made by the Fair Work Commission.
- Support people seeking to access services and reduce demand by:
a. raising the rate of working age income support payments to at least $76 a day to be in line with the pension; indexing payments in line with wages, as well as price increases, at least twice per year; and establishing disability and illness, and single parent supplements; and
b. making housing affordable for people with low incomes by committing to a 10 year, 25,000 dwelling per year pipeline of social housing investment; and increasing Commonwealth rent assistance to reflect rents paid by lifting the maximum threshold for CRA by 50%, which would double the payment received. - Create a fairer tax system that supports services, safety nets and economic development.
Cassandra Goldie
ACOSS CEO
Key Findings
Funding
- Only 9% of leaders agreed that funding covers the full cost of service delivery – a sharp reduction from last year’s results (20%).
- Only 13% said their organisational overheads, such as administration, management and IT were adequately funded.
- Only 11% of leaders agreed that their organisation’s mainstream of government funding adequately covers increases in wage costs.
- Only 7% of leaders said their main funding source provided adequate support to prepare for and respond to emergencies and disasters.
- Only 6% of leaders perceived indexation arrangements to be adequate.
Finances
- Only 16% of organisational leaders were expecting to see finances improve in 2023. Most leaders reported that their organisations’ finances either remained stable (36%) or worsened (37%) during 2022.
Contracts
- 43% of leaders said their organisations had at least one government contract that lasted 5 years or longer, an increase from last year’s results (40%).
Workforce
- Around half of participants said they felt under pressure due to understaffing. This was very high among CEOs (68%).
- Around half of staff say they feel emotionally drained from their work. Again, this was much higher for CEOs (69%).
- The proportion of staff who intend to remain in their roles in 12 months fell from 71% in 2021 to 62% in 2022.
- 75% of leaders said that throughout 2022, it became more difficult to attract and retain staff.
- 47% of leaders said levels of turnover in their organisation are too high.
Executive Summary
Australia’s community service sector delivers essential services to people affected by poverty, disadvantage and inequality. The sector helps people meet basic needs, build and rebuild their lives after trauma or adversity, and find supportive communities of which to be part. While the sector has been navigating chronic underfunding and other challenges for many years, these have recently intensified.
This report outlines how the community sector experienced challenges during late 2022 and the impact on organisations and staff. Data was collected as part of the Australian Community Sector Survey (ACSS), conducted by the Social Policy Research Centre at UNSW Sydney, in collaboration with the Australian Council of Social Service (ACOSS) and the State and Territory Councils of Social Service.
The information comes from 1,476 community sector staff, including 318 CEOs and senior managers, who completed the ACSS during September and early October 2022. Participants were working closely with clients and communities, in organisations directly delivering services and supports, as well as in peak bodies, and other member-based or representative organisations (see Appendix 1).
The survey captured sector workers’ and leaders’ experiences through a period of converging pressures affecting clients and communities, including inadequate income support payments, rapidly escalating housing costs, a cost-of-living crisis, the continued impact of the COVID-19 pandemic, fires and floods. As shown in the first report from the 2022 ACSS, few community service organisations have been able to consistently meet growing levels of need among clients and communities. This is especially the case in areas of acute shortages, such as for homelessness supports, in the context of Australia’s ongoing crisis of housing affordability and accessibility.
“Everyone is exhausted.” (Senior manager, financial, legal and emergency supports, NT).
This report provides a detailed look at the operational challenges confronting the sector, including funding, contracting and workforce issues. Service providers are facing unprecedented pressure to help growing numbers of people in need, yet resource levels remain inadequate. As a result, community organisations struggle not only to help as many people as possible, but also to plan, optimise and manage all aspects of delivering complex and essential services in a context of rising costs. Organisational leaders and frontline staff are both concerned about how much longer this situation can continue. There is a clear and unmistakable call from survey respondents for improving the adequacy of funding, ensuring government is investing in the full cost of service delivery and ensuring the best possible outcomes for people in need.
Financial position and outlook
Most leaders said their organisational finances either remained stable (36%) or worsened (37%) in 2022. Organisations that rely on philanthropy or commercial income as their most important source of funds were most financially vulnerable, with 53% of these respondents reporting their finances worsened in 2022.
“Governments appear to only want to fund front-line direct service deliver with no consideration of how organisations providing these services become and remain viable and undertake core business service requirements, including reporting governments themselves require.” (CEO, Provider of multiple services, QLD).
“Indexation needs to be considered in all grants, our costs have risen exponentially in the past 12 months and there were no provisions for that in our funding. Wage increases were also not factored in to the extent to which they have risen very recently.” (Senior Manager, Provider of multiple service types, TAS).
“Indexation is a huge challenge facing our sector. Cost of living pressures on staff are forcing them to look for higher paid work elsewhere, rather than remain in current roles.” (CEO, health-related service, NT)
Financial expectations for 2023 were mixed. Most leaders expected their organisation to continue its 2022 trajectory. Only 16% expect to see finances improve in 2023. Many said their organisations are being squeezed by rising operational costs and increased expectations of service delivery, without the increases in required financial support.
Government funding and contracts
Government funding remains integral to the sector’s capacity and effectiveness.
Most leaders (84%) reported that their organisations received funding from a state or territory government, and 71% received funding from the Australian Government (including from the NDIS and Primary Health Networks).
State and territory governments were the main income source for just over half of organisations (54%), with the Australian Government the most important source of funding for 31% of organisations.
A total of 43% of leaders said their organisation had at least one government contract or grant that was five years or longer. This is a slight increase from the previous year (40%).
However, while increasing prevalence of longer contracts is encouraging, organisations are constrained by deteriorating real funding levels, where indexation has not accounted for rising costs.
Adequacy of government funding
When asked about their most important stream of government funding, only 9% agreed with the statement “Funding covers the full costs of service delivery”. This figure has plummeted in the past year; in 2021 the figure was 20%.
Sector leaders reported that funding inadequacy holds back the sector’s capacity to meet levels of community need, to maintain and develop the workforce, and to monitor quality, ensure safety, collaborate with government, and plan for the future.
Coverage of workforce costs
- Only 11% of leaders agreed that their organisation’s main stream of government funding adequately covers increases in wage costs;
- 14% agreed it enables them to attract and retain quality staff.
- 20% said funds were adequate for employing staff at appropriate classifications.
- 21% said funds adequately covered supervision for staff.
Coverage of quality and safety
- Only 14% said their main funding source provided adequate support for monitoring and evaluation.
- 35% said the funding was adequate for ensuring client and worker safety.
Collaborating with government and communities
- Only 12% said funds were adequate for involving consumers or people with lived experience.
- 14% said it adequately covered costs of engaging with government policy and reform processes.
Planning and sustainability
- Only 7% said their main funding source provided adequate support to prepare for and respond to emergencies and disasters.
- 13% said their organisational overheads, such as administration, management and IT were adequately funded.
- 18% said their main funding source allows the organisation to reliably plan for the future.
Indexation
Indexation offers a way to maintain the real value of the sector’s funding over time. However, indexation is patchy and inconsistent, and is failing to maintain real funding levels.
- Only 16% said that all their government funding was indexed.
- For 10%, none of their government funding was indexed.
- Only 10% receive enough notice about indexation for their planning.
- Even fewer, only 6%, agreed that overall, indexation was adequate.
Workforce
Community sector organisations face persistent difficulties attracting and retaining suitable staff.
One of our experienced financial counsellors left last month to become a truck driver, earning significantly more as a result. (CEO, Provider of multiple services, WA)
- The proportion of staff who intend to remain in their roles in 12 months fell from 71% in 2021 to 62% in 2022. Many are looking for mobility, for higher pay or more security, in their current organisation.
- 75% of leaders said that throughout 2022, it became more difficult to attract and retain staff.
- 47% of leaders said levels of turnover in their organisation are too high.
Community service workers are also badly affected by the cost-of-living crisis. For some it is seriously affecting whether they can continue working in the sector and maintain a decent quality of life. While certain organisations have been able to offer higher wages, this has not been an option for all. The housing crisis means affordable local accommodation for staff is lacking in several locations, making recruitment particularly difficult.
3 of my staff were made homeless this year. (Senior manager, housing and homelessness service, Qld).
Many staff are dissatisfied with aspects of their work, which even though it is complex and challenging, is perpetually undervalued by government and others. Poor wages and conditions are affecting workers’ ability to access housing, to accumulate superannuation and achieve financial stability.
- Only half (50%) agreed they receive decent pay.
- Only a third (32%) expect to have enough superannuation when they retire.
This [attracting and retaining staff] is a continuing problem. The challenge is both the pay (we cannot compete with the private sector, government or larger charities) and also the intensity and level of work required from staff. The value of the work continues to be a strong selling point, but people are exhausted, and other sectors offer more pay for less stress. (CEO, Provider of multiple services, NSW)
Alarmingly, some respondents commented that it is young people or workers with non-work sources of financial security, such as a well-paid partner, who can afford to work in community services. Further, many find the non-financial rewards of working in community services have been eroded, and feel overwhelmed trying to make a difference in under-resourced organisations.
- Around half of participants said they felt under pressure due to understaffing. This was very high among CEOs (68%). Correspondingly, around half of staff say they feel emotionally drained from their work. Again, this was much higher for CEOs (69%).
- Many community sector workers continue to lack job security: 18% disagreed that their working arrangements are secure, and this was much higher for those in policy, program and research roles (32%).
Unpaid hours
In addition to their paid hours, the community sector workforce continues to contribute substantial amounts of unpaid time, helping underfunded and understaffed organisations to support as many people as possible as best they can. Reflecting high levels of community need, inadequate funding to meet demand and a strong commitment to people needing help unpaid work became increasingly prevalent during 2022.
It seems to be accepted that workers in the community sector will do additional unpaid hours on top of low remuneration and not questioned. This leads to burnout and low quality standards of services delivered, impacting on those who need the support. (Senior manager, Provider of multiple services, Vic)
Whereas in 2021, 55% of community sector workers said they had performed one hour or more of unpaid work in the week prior to the survey, in 2022, 68% had done so.
- 90% of CEOs worked one hour or more which was unpaid in the previous week. On average CEOs contributed 13.1 hours of unpaid work per week, in addition to an average of 35 paid hours. This equates to over two unpaid hours for each workday. As such, their unpaid hours comprised 26% of their total paid and unpaid working time.
- 62% of frontline workers contributed one hour or more of unpaid work in the last week. On average, frontline workers contributed 2.7 hours each week. Their unpaid hours comprised 8% of total work hours.
- Unpaid work was also very common in the smallest organisations (fewer than ten staff). A total of 81% of respondents in small organisations performed an average of 9.5 unpaid hours in the previous week.
- Where workers felt under pressure due to understaffing, they were more likely to report unpaid work: 77% of those experiencing understaffing did unpaid hours, compared with 45% who did not feel under pressure due to understaffing.
Strengthening the community sector: adequate and secure funding
The ACSS is integral as a sector-led, sector-owned national data initiative. It has helped understand the challenges faced by sector organisations and workers, and ways to build and support capacity, sustainability, and impact. The survey has shown consistently, over a number of years, that the community sector has been operating on a shoestring. Clearly, that shoestring is now frayed and broken, held together by knots made by the enduring goodwill and commitment of sector staff. But the sector can only run on goodwill for so long. Workers, leaders and organisations are at breaking point. In this iteration of the ACSS, more participants, from leaders to frontline workers, have reported that the sector is struggling. They cannot maintain their valuable work without meaningful recognition, most importantly through secure, sufficient funding that enables decent pay and sustains quality services for clients and communities.
Commitment from governments to adequate funding of the sector, and (indexed) equal pay, would be nice! (CEO, Provider of multiple service types, NSW)
Indeed, when asked what would strengthen the sector, the response was clear: adequate and reliable funding. Participants described this as government investment which covers the full cost of service delivery, including the provision of decent equitable wages; funding that is indexed to address changes in costs over time; and funding contracts that provide long term stability – both for community members who need ongoing service provision, and for staff who need employment security.
1 Funding and financial outlook
The survey sought to understand the sector’s financial situation and outlook, including the ways funding arrangements can improve the capacity of providers and their ability to manage their services, workforce and general operations.
1.1 Sources of funding
Types of funding
To obtain an overview of funding arrangements, CEOs and senior managers were asked to indicate whether their organisation obtained any income from state and territory governments; the Australian Government; National Disability Insurance Scheme (NDIS); Primary Health Network (PHN); local government; client fees; other commercial funding; philanthropy, or other sources.
On average, large and medium organisations reported receipt of three or more different sources of funding, while smaller organisations reported receiving around two (Appendix 2 Table A. 4). Government funding sources were most common, with philanthropy and commercial income playing supplementary roles. Most leaders (85%) indicated that their organisation received some funding from a state or territory government. Almost two-thirds (64%) received Australian Government funding. A total 26% of leaders stated they received NDIS funding, and 19% stated they received Private Health Network (PHN) funding. Almost a quarter received local government funding (23%).
In terms of non-government funding sources, over half of organisational leaders reported that their organisation received funding from philanthropic sources (56%), 28% received client fees or charges, and 20% received funds from another commercial source.
Most important source of funding
Over half of leaders responded that state or territory governments were their organisation’s main income source (54%), while 31% identified the Australian Government, and 16% reported it came from another source (Figure 1.1). Philanthropy was the most important funding source for only 8% of organisations. Similarly, many organisations had some commercial income, but very few senior leaders said these streams were most important: client fees were most important to only 3%, and other commercial sources to only 4% (Table 1.1).
State and territory funding was most important to 82% of those organisations focused on domestic violence and family services, but only 18% of those focused on ageing and carer services, and 17% of those focused on employment, education and training (Figure 1.2). Australian Government funding was the most important source for 77% of organisations focused on ageing and carer services, and 71% of those focused on disability services, but only 14% of DFV and other family services. Non-government funding sources (philanthropy and commercial income combined) were most important to 26% of organisations focused on financial, legal and emergency supports and 20% of those focused on health, but smaller proportions of other service types.
Figure 1.1 Most important source of funding in 2022
Table 1.1 Receipt of funding from different sources
Figure 1.2 Proportion of organisations whose main source of funding was a State/territory government, Australian Government, or other source
1.2 Financial position during 2022
Most CEOs and senior managers reported their organisation’s finances either stayed the same (36%) or worsened (37%) in 2022. A total 22% of leaders reported that their organisational finances improved; by comparison this figure was 31% in 2021 (see Table A. 6).
The data also indicated budget challenges for a large number of organisations delivering services on behalf of government. Among leaders in organisations whose most important source of funding was a state or territory government, a third (32%) experienced worsening finances in 2022 (Figure 3.3). Among those whose main funding source was the Australian Government, the figure was 37%. Reflecting the challenging funding environment, those reliant on philanthropy or commercial income streams fared particularly poorly, with more than half (53%) experiencing deteriorating finances in 2022.
Given that the sector has experienced chronic under-funding for over a decade, organisations reporting that finances have stayed the same or worsened tends to be a major concern.
Figure 1.3 Leaders’ assessment of change in their organisation’s financial position during 2022, by main funding source
Even with 2022 being a poor financial year for many respondents, expectations for organisational finances in 2023 were mixed. When asked about their expectations for the coming year, 40% of leaders expected their position to stay the same, a third expected it to worsen, and only 16% expected to see improvement in 2023. Expectations for 2023 largely reflected organisation’s experiences during 2022.
1.3 Expectations for 2023
Among those for whom conditions improved in 2022, 42% expected to see continued improvement, and only 13% expected their finances to deteriorate. The converse was evident among those who experienced worsening conditions in 2022; among these leaders only 11% expected improvement, and over half (53%) expected to see their position deteriorate further.
Figure 1.4 Leaders’ expectations for their organisation in 2023, according to their 2022 financial status
When asked for comments about their organisation’s finances, the most common response was for leaders to explain why they felt their organisation’s finances were likely to improve or worsen. A few pointed to reduced philanthropy, or diminished rental, investment or other commercial income. However, leaders most often pointed to converging pressures of rising operational costs (including staffing costs), increased need and expectations of service delivery, and no increase in financial support from government. Many pointed to poor indexation rates and lack of certainty about the future of their funding, which left organisations with few options other than running deficits or withdraw services. Many leaders said things like:
No increase to payments despite cost increases = failure imminent. (Senior manager, Disability Services, Qld)
Income is relatively stable but costs, especially wages have increased markedly. Financial planning (post pandemic/hybrid) is very difficult. (CEO, Financial, legal and emergency supports, Vic)
The organisation’s overall income has grown (due to new programs) but viability has reduced significantly as funding does not meet the real cost of service delivery. (CEO, Provider of multiple services, Tas)
Some leaders commented that the premature withdrawal of pandemic supports had left them in particularly risky positions. One explained, for example:
Covid-era government funding has ended but our pre-Covid sources of funding (notably corporate sponsorship) have not returned, due to low risk tolerance and more precarious financial positions. (Senior manager, Emergency relief, NSW)
Many organisations were waiting to finalise their finances for the coming year, with those organisations part of tender processes in particularly precarious positions:
We will be tendering for delivery of current programs so we are in a holding pattern and may need to reduce services if unsuccessful (CEO, community development, VIC)
We have some 3-year grants that are completed in 2023 and it is unknown if they will be re-funded (Senior manager, Financial, legal and emergency supports, NT)
We have budgeted for a loss in FY23 in order to meet the needs of our clients/communities due to increase costs of doing business. We are awaiting clarity of ongoing Australian Government funding. (CEO, Domestic and family violence service, Tas)
Organisations were undertaking a range of actions to improve their financial outlook. Many described developing new income streams or redirecting funds internally. However, these alternatives were frequently seen as less than ideal, potentially distracting from service delivery, with the possibility of additional costs. These leaders explained:
We put more resources into gaining philanthropic support, which takes resources away from front line activities. (CEO, health related service, ACT)
The organisation has a number of sources of funding so is therefore ‘healthier’ than others in the sector but the increased funding has brought its own issues in the organisational structure that needs to be addressed, that is a big project on its own and needs specialist knowledge. Funding doesn’t cover that sort of work. (CEO, Financial, legal and emergency supports, WA)
Where organisations with a positive financial outlook made comments, they attributed their status to their organisation receiving increased government funding and grants to undertake critical work, as well as their ability to redirect funds internally. However, this was not ideal:
There will be a time when we cannot meet increased demand. So far we have redirected funds from fee for service programs but in doing so have delayed development issues. Continued increases cannot be sustained by redirection of own funds. (CEO, provider of multiple services, QLD)
Organisations also attributed their positive financial performance and outlook to the exceptional dedication and hard work of their staff, and even where they were doing well, they had ongoing concerns about their financial sustainability and future:
We have put a great deal of scrutiny, time and energy into reducing costs and increasing efficiencies to become more financially sustainable. (CEO, provider of multiple services, WA)
We are managing to keep our heads above water operationally, but only through sheer hard work and determination. The real concern is that we haven’t got the money available to invest in the future, or to put money back into our depleted balance sheet and assets to ensure ongoing financial stability. (CEO, provider of multiple services, QLD)
2 Government funding
In 2022, sector leaders continued to report that government funding arrangements were inadequate for maintaining their organisation’s viability and capacity to deliver high quality, essential and complex services to communities. They also identified priorities for change, including indexation.
2.1 Duration of funding agreements
Past research has shown that short funding timeframes have made it more difficult for organisations to plan their operations, to attract and retain staff, and to sustain outcomes for clients and communities. This year’s ACSS explored the prevalence of five-year contracts, as an indicator of the adequacy of contract duration. In some cases, longer agreements, such as seven-year agreements, are preferable for the sector and government.
In 2021, 40% of leaders said their organisation had a contract, grant or funding agreement with government which was five years or longer in duration. In 2022 this figure was up slightly to 43%. However, most organisations (53%) said they did not have one arrangement of five years or more.
Some organisations appear to have better access to longer contracts than others. Indeed, for some service types (housing and homelessness; financial, legal and emergency supports; and domestic and family violence and other family services) over half the leaders who responded said their organisation had at least one five-year contract (see Figure 2.1). By contrast, this was the case for only 15% of those focused on disability services. Further, those whose main source of funding came from a state or territory government were more likely than others to have a five-year contract (51%) compared with only 35% of those whose most important funding source was the Australian Government (see Appendix Table A. 6).
Figure 2.1 Proportion of leaders reporting their organisation had a government funding agreement of at least five years in duration
In their comments, leaders generally welcomed five-year contracts, but highlighted some challenges they raised. In particular, leaders pointed out that without adequate indexation, long agreements could lock in deteriorating funding levels. As these leaders explained:
I think five year funding is great, however, our experience is that we have not been able to keep up with wage rises/ CPI increases so four of my programs are in deficit. 2018 funding is a lot different to 2022. (Senior manager, DV and family services, NT)
Right now, we are facing increased operational costs in line with the rising cost of living, but our contract is locked in for five years and comes with a very loud message of “that is all the money you’re getting…there is no more”. (CEO, Provider of multiple services, NSW)
Others were concerned about the impact on service delivery when the five years ended, for example:
Stability of five year funding is great, but we aren’t able to maintain capacity at our current level when the funding agreement expires. (CEO, Health service, NT)
Finally, some continue to miss out:
Our sector was supposed to have five-year agreements. Hasn’t happened. Inadequacy of funding will be a constant, but security of funding does not need to be this bad. (CEO, Financial, legal and emergency supports, NSW)
2.2 Coverage of costs
In 2022, the vast majority of organisational leaders continued to report that funding from government was not enough to cover the full costs of service delivery. A total of 80% of leaders disagreed with the statement “Funding covers the full costs of service delivery”, increased from 76% in 2021 (Figure 2.2).
Moreover, the proportion reporting that funding did cover full costs plummeted from 20% in 2021 to just 9% in 2022 (or, from one in five services to one in 11). This figure did not differ significantly across types of services.
Figure 2.2 Proportion of leaders who agreed with the statement “Funding covers the full costs of service delivery”, 2021 and 2022
Inadequate funding leaves organisations and their staff severely restrained in their capacity to assist communities in need. Data from the first report into the 2022 ACSS showed that only one in eight leaders (12%) agreed with the statement “Funding enables us to meet community demand”. In addition, low numbers of leaders reported that funding enables them to meet their workforce, planning and regulatory needs, although many were neutral or unsure (Figure 2.3).
- Only 14% agreed that funding enables them to attract and retain quality staff, and
- Only 18% agreed that funding allows the organisation to reliably plan for the future.
- Larger proportions reported that funding enables the organisation to meet regulatory obligations (38%), however, this figure is still very low.
Figure 2.3 Proportion of leaders who agreed with statements about their main source of government funding
The adequacy of government funding is explored in more detail in Figure 2.4.
Workforce
Few leaders reported adequate funding for managing their workforces. Problematically, 45% said backfilling when staff were absent was not funded at all, while almost as many (44%) considered it underfunded. Many leaders also reported their main funding source did not adequately fund them for recruiting and inducting new staff, managing volunteers, and providing professional development. Indeed, less than one in five leaders said their organisations were adequately funded for essential aspects of their workforce management and development:
- Only 11% said their main income stream enabled them to employ enough staff;
- 11% said it adequately funded increases in wage costs;
- 20% said their main government funding stream was adequate for employing staff at appropriate classifications
- 21% reported funding was adequate for providing supervision.
Quality and safety:
- Just over a third (35%) rated their main government funding stream as adequate for ensuring client and worker safety;
- 14% considered it adequate for their monitoring and evaluation functions.
Working with government and communities
Lack of funding also undermines collaboration, including between the sector and government:
- 14% said their main source of government funding was adequate for engaging with government policy and reform processes, while the vast majority were either unfunded (45%) or underfunded (37%).
- Less than one in four (23%) said they were adequately funded for contract administration and reporting.
- Problematically, only one in eight (12%) said they were adequately funded to genuinely involve consumers or people with lived experience.
Planning and sustainability
Better funding is also needed to support planning and sustainability:
- Only 7% said their main funding source was adequate for preparing for and responding to emergencies and disasters,
- 11% said it provided them with adequate funding to plan for community need.
- 13% said their organisational overheads, such as administration, management and IT were adequately funded, with the vast majority reporting that these were underfunded (72%).
Figure 2.4 Leaders’ views on which functions are adequately funded, under-funded or not funded (n=300)
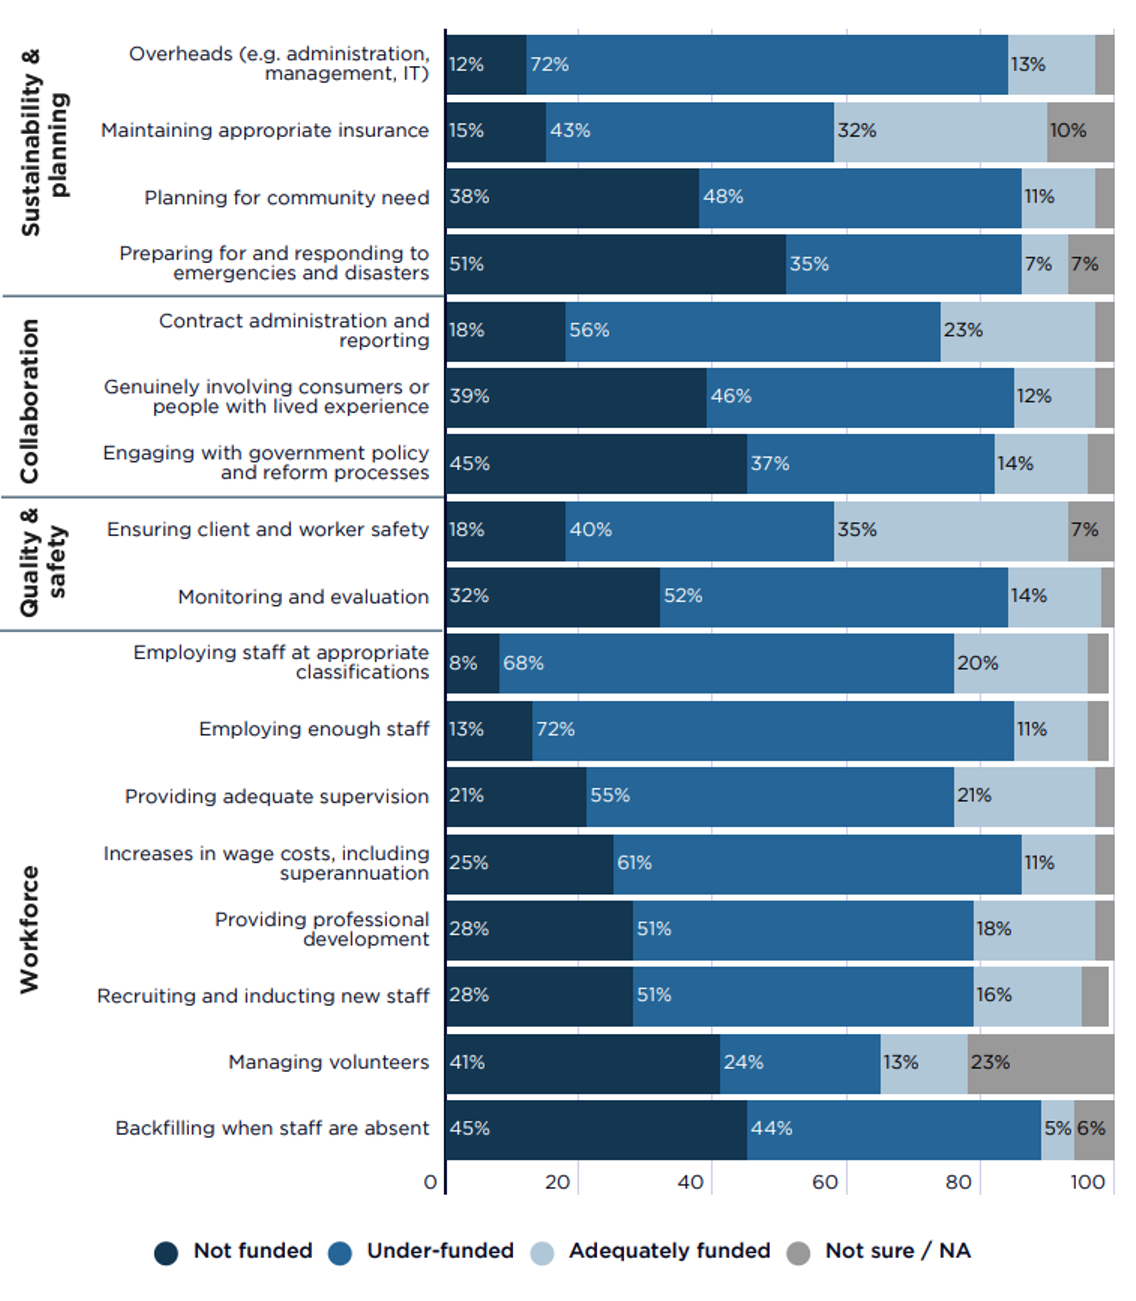
NB: the question was asked in relation to the organisation’s most important stream of government funding.
2.3 Indexation
Indexation helps ensure funding amounts keep pace with rising operational costs, so the real value of contracts do not erode over time. However, for many years now, the sector has observed indexation of government funding as inconsistent, inadequate and/or opaque, failing to cover rising wages and other costs faced by organisations.
How much government funding is indexed?
Around one in six leaders (16%) said all the government funding their organisation received was indexed, while a further 27% stated that most of their government funding was indexed (Figure 2.5). However, one in ten leaders (10%) said none of their organisation’s government funding was indexed, and around the same number (11%) said less than half of it was.
Among organisations where the main funding source was a state or territory government, 19% of leaders reported that all their government funding was indexed, and a further 32% reported that most of it was. By contrast, in organisations where the main funding source was the Australian Government, only 9% and 24% respectively said all or most of their funding was indexed.
In addition, in organisations mainly funded by state and territory governments, only 7% said none of their government funding was indexed, compared with 15% of those mainly funded by the Australian Government.
Figure 2.5 Leaders’ reports of how much of their government funding was indexed, by organisation’s main funding stream
Perceptions of indexation
Leaders were asked about indexation for their most important government funding stream.
As shown in Figure 2.6, only 6% agreed that overall, indexation was adequate, with 60% disagreeing. Very few leaders of service delivery organisations (4%), and 12% of leaders in peaks, representative or other organisations, reported that indexation was adequate.
Comments indicated that governments do not always offer transparent information about indexation, with one CEO for example describing it as a ‘closely guarded secret’. Correspondingly, many said they were not familiar with the way funding was indexed. As shown in Figure 2.7, only 36% of respondents felt they were familiar with the indexation formula. Very few (6%) agreed they had input into how their funding was indexed, and the majority disagreed (63%). Only one in ten respondents stated they got enough notice about indexation for organisational planning.
Indexation never covers increased costs. (Senior manager, Provider of multiple service types, Qld)
‘It baffles me why this [indexation] remains such a closely guarded secret and lacks transparency and consultation’ (CEO, DVF and family service, ACT)
‘We budget months before indexation is certain and have to re-write budgets to reflect indexation’ (Senior manager, health service, Qld)
Figure 2.6 Proportion of leaders who agreed and disagreed with the statement “Overall, indexation is adequate”, by type of organisation
Figure 2.7 Proportion of leaders who agreed with statements about indexation
Comments on indexation
When sector leaders were asked to comment on indexation, they most often discussed the inadequacy of indexation rates. They noted that the indexation rates that were passed onto organisations were below rates of inflation. Leaders most often commented on the way indexation has not been high enough to address significant cost increases, particularly rising wages, but also other operating costs:
SCHADS [Social, Community, Home care and Disability Services Industry Award] increase was 6.4% increase. Indexation needs to cover this. (CEO, Health service, Qld)
Costs have escalated way beyond levels anticipated when current indexation figures were being developed. (CEO, Provider of multiple services, SA)
As government did not fully cover the increases in costs faced by organisations, some needed to reduce staff or staff hours, or cut back on service delivery.
A number of other participants were struggling with inconsistent application of indexation. They noted confusion and difficulties budgeting due to rates differing across governments, across departments, across funding programs, and across time.
Only State Government funding is indexed, Federal funding is greater share of grant funding but not indexed. (CEO, Provider of multiple services, Qld)
Indexation has been very low / inadequate for many years. Federal Government indexation is much lower again than State Government. (CEO, Provider of multiple services, Tas)
Even while some Australian Government departments fund indexation, others do not. (Senior manager, Provider of multiple service types, NSW)
It’s hit and miss between programs. (Senior manager, DVF and family services, NSW)
Frustration around indexation was also related to a sense that government departments make decisions about this important issue without involving the sector. They called for greater transparency about the indexation rate and how it was determined.
Indexation is a big slow black box that doesn’t meet the needs of the service providers in the sector. This financial year should be particularly embarrassing to the Government – with organisations wearing massive inflation while Government considers increasing indexation at the pace of a legless turtle. (CEO, Provider of multiple service types, Qld)
Decisions made by government without inclusion from on the ground orgs. (CEO, Disability service, Qld)
With the exception of the recent increase from Treasury, the indexation conversation is rarely shared. (CEO, Housing and homelessness service, Qld)
In some states, governments had increased indexation rates in response to the high inflation environment, and where this occurred, it was welcomed. However, in the twelve months to the December 2022 quarter, the CPI rose by 7.8% and nowhere were increases sufficient to meet this level of cost increase.
2.4 Leaders’ comments on government funding
CEOs and senior managers were given an opportunity to comment on government funding, and any impacts of inadequate funding. Positive comments about funding were very rare, but those positive comments show the benefit of funding adequacy when it occurs.
As a neighbourhood centre we are very excited about the increase in funding announced in the June State budget and are in the process of planning how to best use this resource to support our community. (Senior manager, Provider of multiple services, Qld)
Indexation is very important and sufficient funding to cover the true cost of service delivery. (CEO, Community development service, Tas)
2.4.1 Reasons for inadequate funding
Many CEOs and senior managers noted the gaps between funding levels and what their organisations need to adequately operate. They explained that funding had not kept pace with increases in wages and rising cost of service delivery; and that contracts placed restrictions on how funding could be spent, which overlooked some essential costs, such as service administration and planning.
A key issue is that funding has not been adjusted to fully recognise cost increases, including the wage increases awarded as a result of the Equal Remuneration Order (ERO):
Indexation does not even go close to keeping up with ERO increases and other rising costs, meaning that we have less money in real terms than we had a decade ago, at the same time as demand has increased significantly. (CEO, Child and youth services, Vic)
Inadequate funding doesn’t cover the historic costs of the ERO, National Wage Increase + superannuation guarantee contribution increase and increased expectations of funders to report on outcomes and social impact. (CEO, Provider of multiple services, WA)
Others noted that contract arrangements constrained funding levels, and locked organisations into arrangements which undervalued them:
Contracts are capped with not even CPI increases from year to year making it so challenging to cover wage and utility increases with income set at 2019 values. (Senior manager, Housing and Homelessness service, SA)
The removal of CPI increases from federal funding contracts was disastrous. Our funding has been going backwards in real terms for more than six years. (Senior manager, Provider of multiple service provider, ACT)
Others pointed out that government restrictions on the use of funds meant some essential costs could not be covered. These leaders explained how administrative and other back-office supports were not seen as legitimate service delivery costs by government, nor were the cost of compliance, evaluation or quality improvement.
No funding for staff travel and accommodation. (CEO, Ageing and carer services, Qld)
Most funders don’t understand or fund for anything beyond direct service delivery and expect services to self-fund the quality, safety, evaluation & compliance internally. (CEO, Health service, WA)
Growing compliance requirements (eg child safe; sexual harassment) is not covered; Quality Improvement / Accreditation is not covered; Travelling/accommodation costs associated with meeting with Government is not covered. (CEO, Provider of multiple service provider, Tas)
2.4.2 Impact of inadequate funding
Some CEOs and senior managers commented on the ways inadequate funding impacts on their service delivery, staff, and their ability to plan for the future. Concerningly, they underline how inadequate funding places service delivery at risk:
The new national PHN funding template is not viable for our organisation as a maximum of 8% overhead costs, therefore our organisation is no longer able to tender for new PHN contracts and will exit existing services if funding is reduced. (Senior manager, Provider of multiple services, NSW)
We are now grappling with the cumulative effect of years of inadequate indexation – and there simply is nothing more we do to rein in costs or generate efficiencies without compromising our capacity to do our core functions. (CEO, Health services, ACT)
Leaders also pointed out the way that low and short-term funding made it difficult to attract and retain staff:
Like many ACT based NGOs we struggle to attract and retain suitably qualified staff who can earn more money working in the public service. (CEO, Provider of multiple services, ACT)
Short term funding makes it difficult to attract appropriate staff. There are insufficient staff available to recruit and it is an extremely time-consuming process with insufficient funding to cover this. Increased regulation not matched by increases in funding to cover these activities makes it very difficult. (CEO, Health services, WA)
Short-term contracts and late notification of extension signficantly impact our ability to retain staff as they seek more stable employment elsewhere. (CEO, Provider of multiple services, SA)
Further, they point out how low funding contributes to a poor psychosocial environment for staff, and stress:
Just makes my team feel that they are never doing a good enough job as we can’t be across everything we need to be. (CEO, Financial, legal and emergency support services, WA)
12.1% gap between the cost of homelessness service delivery and contract price leading to service closure, stress, staff going over and above etc. (CEO, Housing and homelessness service, WA)
Further, leaders commented that funding arrangements make it difficult to develop strategy and plan for the future:
Short term (12 – 24 month) contracts don’t enable long term planning for services or staff. (CEO, Health service, Vic)
All management are so busy doing the day to day there isn’t any capacity to offer anything else from a strategic perspective. (CEO, Children and youth services, Qld)
Lack of funding to plan and prepare for the future was particularly problematic for those supporting communities affected by disasters and extreme climate events. As well as needing funding at levels that would enable them to conduct their core business in the context of disasters, they also needed funding to effectively prepare for, prevent and respond to disasters. This included resources to plan, collaborate and advocate for affected communities:
Funding! Two bits: We need sufficient funding to meet regular needs for advice, which will generally be able to be reassigned in an emergency. We also need funding for advocacy and community engagement to ensure reforms that will prevent people confronted by disaster being impacted as negatively. Currently, we do not have the resources to adequately represent our community and work through these issues. (CEO, Legal services, NSW)
3 Sector workforce
National statistics demonstrate rapid growth in Australia’s community sector workforce. However, some of the most concerning findings in the 2022 ACSS relate to the state of the sector’s workforce, and the way workers are bearing the costs of systemic underfunding. ACSS data shows organisations are continuing to face difficulties attracting and retaining staff. More staff are intending to leave their roles compared with the previous year, although many are looking for better roles (such as promotions) in their current organisation. Data also reflects the dissatisfaction of many workers with aspects of their work, and reveals the large amounts of unpaid work they are contributing to underfunded organisations, in addition to their paid hours.
3.1 Staff retention
Most leaders felt that recruitment challenges worsened in 2022. Indeed, three quarters of leaders (75%) said that throughout 2022, it had become more difficult to attract and retain staff (Figure 3.1). Leaders across all types of organisations and in all jurisdictions reported that finding and holding staff had become more difficult. In addition, nearly half of leaders (47%) reported that staff turnover in their organisation was too high, and high turnover was especially an issue for larger organisations (see Table A. 9).
Great resignation has led to loss of staff and difficulties in recruiting new staff which impacts on our ability to service our clients. (Team Leader, housing and homelessness service, VIC)
Figure 3.1 Leaders’ perceptions of whether it had become easier or more difficult to attract and retain staff during 2022
Leaders commented on attracting and retaining staff, with their responses suggesting that attracting new staff has become especially difficult. They made comments like:
It’s diabolical to recruit in WA right now. Staff vacancies and onboarding times have increased. (CEO, Provider of multiple services, WA)
Small turnover but it’s much more difficult to find new staff especially in specialist roles. (CEO, Financial, legal and emergency support services, NSW)
Qualified and experienced Homecare workers are in most short supply. Young (18-40) workers are in even more short supply. (CEO, Health services, WA/Tas)
Several participants wrote that it is challenging to recruit staff with the right skills, qualifications and experience:
It is becoming more difficult to recruit appropriately trained and qualified staff. (CEO, Provider of multiple services, NSW)
Recruitment is very hard at the moment, difficult to attract qualified and experienced staff. (CEO, Community development services, Vic)
A number of participants explained that attracting and keeping good staff was especially difficult in regional and rural areas, with new staff unwilling to move to regional areas, and existing staff leaving to move to the cities. A few noted that it is easier to retain existing staff than to recruit new staff.
Many reported that low wages, especially in contrast to government and corporate sectors, have a significant impact on their ability to maintain good staffing levels, affecting both recruitment and retention.
All organisations are seeking the same staff and we are competing with high government salaries we cannot match. (CEO, Health service, NT)
We attract good candidates based on our organisational reputation but then at times cannot salary match or provide the job security to lure them across. (Senior manager, Housing and homelessness service, SA)
Alarmingly, some reported that such low wages meant that their organisations were relying on a young workforce, because people with greater financial responsibilities cannot afford to work in the community sector. This has implications for diversity in the workforce, staff experience and retention as well as career progression.
We rely on a values based and collegial culture, and many young staff. As there is no way we could retain people based on the money we can pay. We are also losing staff (especially young staff once we have trained them!) to government, and better paid sectors such as health. (CEO, Children and youth services, Vic)
Mission-driven work and great workplace culture are no longer enough to attract and retain staff. This is … a diversity and inclusion issue. We can only retain staff without dependents or a mortgage (usually in their 20s) or people who are have other sources of financial security (spouse’s income, retired after a lucrative career, or otherwise independently wealthy). (Senior manager, Financial, legal and emergency supports, NSW)
Additionally, with such low wages on offer, several participants reported that their ability to attract or retain staff was also affected by a lack of affordable rental accommodation.
Services struggle to attract talent, which is made worse with the lack of affordable housing – noted statewide. (Senior manager, Provider of multiple services, Qld)
When there are no housing options, attracting and retaining staff is very difficult. (CEO, Community development services, NSW)
One senior manager made the shocking revelation that staff working supporting community members with housing and homelessness were made homeless themselves:
Three of my staff were made homeless this year. (Senior manager, housing and homelessness service, Qld).
Some organisations have been able to respond to this challenge with higher than award wages to attract staff, but others said this was not possible. A couple commented that the nature of the work and the sense of making an important social contribution attracted staff despite the low wages, but observed that this is increasingly difficult. Indeed, the appeal of work that makes a difference to community is waning, as staff leave after becoming tired and burnt out:
Burnout is also a big issue and we are seeing teachers and educators leave the ECEC [Early Childhood Education and Care] profession in droves across the nation. We simply have ads out without a single response when we do try to recruit. (Senior manager, Provider of multiple services, ACT)
I think we are all worn out and whilst mental health and well being is a strategic focus for this organisation, we can only do what we can with limited resources. I always provide staff with supervision time in my own time. (CEO, Community development services, NSW)
Challenges with recruitment and retention were further compounded by the frequent use of short term and insecure employment contracts to match short term government funding contracts.
Short term service contracts negatively impact on staff recruitment and retention. (CEO, Provider of multiple services, WA)
It is quite difficult to attract/retain staff when the funding is only for 12 months at a time. (CEO, DVF and family services, NSW)
3.2 Future plans of staff
Corroborating leaders’ perspectives on recruitment and retention difficulties, staff are increasingly looking for other roles, although often this is within the organisation. A fall in the proportion of staff intending to remain in their roles in 12 months is evident. Whereas in the 2021 survey, 71% intended to remain working in their current role in 12 months, in 2022 this figure was 62%. However, among those planning to leave their roles, the largest group hoped to move into a new role in their current organisation (see Table 3.1). When asked why, these staff indicated they wanted more senior roles and higher pay, or were hoping to find another role when their contract ended.
Appendix Table A. 10 provides a breakdown by roles. CEOs are more likely than others to intend to remain in their role: 74% planned to remain in their current role in 12 months, while 10% intended to move to another community organisation, and a further 10% intended to move to an organisation outside the sector. Among frontline workers, 59% planned to remain in their current role and 26% were seeking another role in their organisation. Smaller proportions wanted to move to another community organisation (7%) or to obtain a role outside the community sector (5%). However, the intention of 12% of frontline workers to leave their organisation indicates significant challenge.
Table 3.1 Where staff plan to be working in 12 months
Note: For 2021 data see Cortis N and Blaxland, M (2022) Carrying the costs of the crisis: Australia’s community sector through the Delta outbreak. Sydney: ACOSS. https://www.acoss.org.au/wp-content/uploads/2022/04/ACSS-Full-2021-Report-v6.pdf
When asked about why they intended to leave their roles, many mentioned pay, and made the point that pay did not reflect the demands of the job, or provide sufficient hours to make a living:
This gig is getting too hard for too little income or recognition – psychologists with no experience get three times the pay and then their clients come to me. (Frontline worker, Domestic violence and family services, SA)
I am exhausted by the hustle for funding, the lack of recognition of the community sector’s important work, and delivering a leadership role with a huge and sophisticated workload for the same salary I made when I left the private sector 20 years ago. I am also concerned that I will not have enough savings/super to retire comfortably. (CEO, child, family and youth service, VIC)
I cannot afford to keep working part time. Although I love this job there is no future here for me. I can no longer cover my basic living expenses with the money I earn working part time and there is no capacity for more paid hours (Office support/Central services, Provider of multiple services, NT)
Those intending to remain in their current roles were more positive, with some commenting for example:
I love what I do (frontline worker, Domestic violence and family services, WA)
For now it suits my needs and I haven’t reached burn out stage yet. (Frontline worker, housing and homelessness, QLD)
l have been in my role for some time and enjoy it even though l know l would be better paid elsewhere. l know our community and feel l can continue to help. (Senior manager, community development, VIC)
3.3 Experiences of work in the community sector
All survey participants were asked about their experiences of working in the community sector, and the results provide further insight into the reasons why so many staff are planning to leave, and why leaders have found staff so difficult to attract and retain (Figure 3.2). Questions related to pay, supervision, professional development, career security, and health and safety. On each measure, many workers were neutral or unsure, however, many areas of dissatisfaction are evident.
Figure 3.2 Agreement with statements about working in the community sector
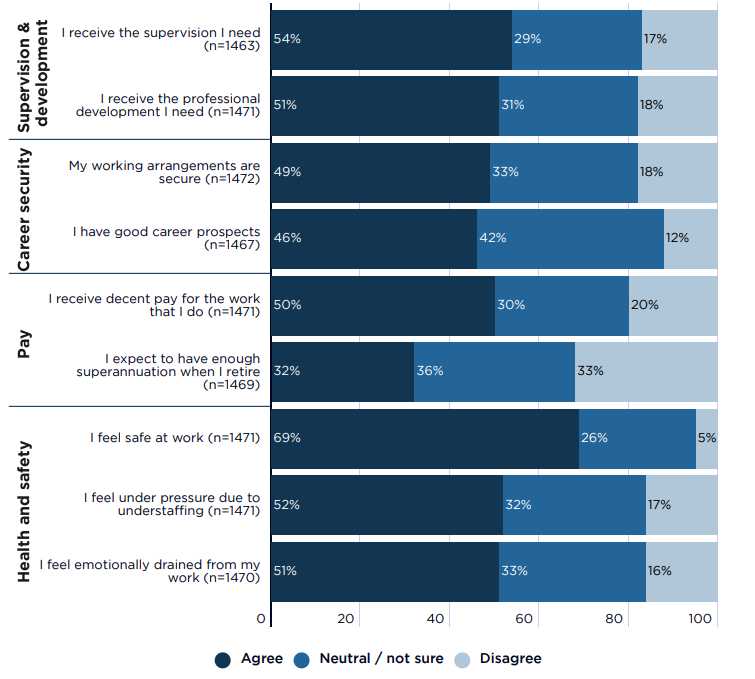
Supervision and professional development.
Overall, 54% of respondents said they receive the supervision they need, and 51% agreed they receive the professional development they need. CEOs and senior managers were more likely than other staff to disagree they received necessary supervision and professional development (see Data in Table A. 11).
Career security and prospects
Even though the community sector workforce has significant jobs growth and requires more staff, just under half (46%) feel they have good career prospects, with many being neutral or unsure (42%). Many community sector workers continue to feel insecure in their roles. Almost 1 in 5 (18%) disagreed that their working arrangements are secure but this was higher for those in policy, program and research roles (32%) and CEOs (26%).
Pay
In terms of pay, half (50%) of respondents agree they receive decent pay, while 20% disagree and 30% were unsure. Senior staff were more likely than others to disagree. Only one-third of respondents expect to have enough superannuation when they retire, but this figure is lowest among team leaders/ coordinators and frontline practitioners (see Table A. 11).
Health and safety
Most staff (69%) feel safe at work, but pressure due to understaffing, and feeling emotionally drained, is more common. Indeed, around half of community sector workers say they feel under pressure due to understaffing, and this is very high among CEOs (68%). Correspondingly, around half of staff say they feel emotionally drained from their work, and this is again much higher for CEOs (69%).
This was also reflected in survey comments, many of which underlined that burnout is affecting their workforce, for example:
We need to be able to afford supervision for staff and volunteers, but there is no funding for it so everyone is at risk of burn out. (Team leader, Financial, legal and emergency supports, VIC)
Mass Resignations of staff, due to burnout and lack of management support. (Policy, project or research worker, Disability service, QLD)
Without sufficient resources to meet funding bodies’ expectation, staff are experiencing significant workload and burnout. (CEO, health related service, ACT)
3.4 Paid and unpaid hours
Full and part time hours
Many community sector roles are part time. On average, participants reported working 33 paid hours in the previous week. Around 45% of participants worked part time (defined as less than 35 hours per week). Part time hours were most common among frontline practitioners, those in policy project and research positions, and those in other roles while full time work was most common among CEOs and senior managers (see Figure 3.3).
Figure 3.3 Full and part time hours of work, by role
Unpaid working time
In addition to their paid hours, the community sector workforce continues to contribute substantial amounts of unpaid time. Reflecting increased levels of community need and inadequate resourcing, unpaid work increased in 2022. Whereas in 2021, 55% of community sector workers said they had performed at least 1 hour of unpaid work in the week prior to the survey, in 2022, 68% had done so. However, while unpaid work appears more widespread, the average number of unpaid hours performed fell, from 6.0 hours per week in 2021 to 4.8. Across the sector, around one hour in every eight hours of work was unpaid (12% of total working time).
Unpaid work was most common among organisational leaders (see Table A. 12):
- 90% of CEOs and 81% of senior managers worked at least one hour unpaid in the previous week.
- On average CEOs contributed 13.1 hours of unpaid work in addition to an average of 35 paid hours; their unpaid hours comprised 26% of their total paid and unpaid working time.
- On average senior managers contributed 9.5 hours of unpaid work in the previous week, and their unpaid working time was 19% of their total working time.
- 72% of team leaders and coordinators, and 62% of frontline workers contributed at least one hour of unpaid work. On average, team leaders and coordinators contributed 3.3 hours, and frontline workers contributed 2.7 hours.
Unpaid work was also very common in the smallest organisations (less than ten staff), where it was performed by 81% of staff, who performed 9.5 hours, on average (Table A. 13).
These trends reflect the significant tension faced by organisations and their staff to maintain continuity of care for people in need as well as manage organisational operations, even when there is a lack of sufficient resources to properly pay for the work to be performed. It also shows the sector workers’ dedication to the communities they serves and their desire to help as many people as possible despite the challenges it may create in workloads. Indeed, workers who agreed they felt pressure at work due to understaffing were much more likely than others to perform any unpaid work (see Figure 3.4). They also performed more paid work, on average, than those not pressured by understaffing. Those under pressure from understaffing reported 6.2 hours of unpaid work, on average, compared with 3.5 hours among those who disagreed with the statement.
Figure 3.4 Proportion who performed unpaid work, by agreement with the statement “I feel under pressure due to understaffing”
Tasks undertaken during unpaid time
Survey participants were asked to comment on the kinds of work they did in their unpaid hours. Typically, they listed ordinary activities like responding to emails, doing administrative work, making case notes, writing reports or grant applications. This suggests that the workload of these participants, and levels of understaffing, are such that they cannot complete their work during their paid hours.
Indeed, many responded that the tasks performed in their unpaid working time was ‘more of the same’ (Senior manager, Housing and homelessness service, NSW). Comments included, for example:
Regular office customer service tasks (Frontline worker, Disability service, Vic)
Catching up on paperwork, doing my job (CEO, Housing and homelessness service, Vic)
Same working tasks as paid hours (Team leader, Disability service, WA)
Where participants specified the type of task, it tended to be slightly different for senior staff compared to others. The unpaid work of those in managerial positions was concentrated in email, administration and writing of reports, submissions, grant applications or managing program data.
Emails, report writing, reading articles of relevance. (Senior manager, Housing and homelessness services, SA)
Emails, bid/grant applications. (Senior manager, DVF and family services, Qld)
Completing incomplete tasks, paperwork, responding to emails, forward planning, proposals, program updates, grants applications, quality and evaluation activities and processes. (Senior manager, Housing and homelessness service, NSW)
The unpaid work other staff also included email, administrative work and reporting, but also included case work, writing case notes and other paperwork. For example,
Prepare reports, minor program management. (Team leader, Community development service, NT)
Usual tasks, data entry and casework. (Frontline worker, Financial, legal and emergency supports, NT)
Group facilitation, individual support, administration, reviewing program processes. (Frontline worker, DFV and family services, ACT)
Case notes and catch up in general. (Frontline worker, Financial, legal and emergency supports, WA)
4 Strengthening sector capacity
Participants were given an opportunity to make comments or suggestions on how to strengthen the community sector. Sector leaders, with oversight of their organisations, had somewhat different priorities to other workers, but agreed on funding. A need for increased funding and greater funding security was mentioned most often by both staff and by CEOs and senior managers. For example:
The community sector could be further strengthened by increased support and access to more funding/grants to be able to offer more programs and services to the community. (Team leader, Community development services, NSW)
Always more funding for more staff. (Frontline worker, Provider of multiple services)
Commitment from governments to adequate funding of the sector, and (indexed) equal pay, would be nice! (CEO, Provider of multiple services, NSW)
These quotes are reflective of commonly held perspectives within the sector that increased and secure funding are urgently needed to strengthen services and operations, and better remunerate the workforce. Often, improved funding and pay were regarded as a form of recognition of the value the of sector workers. Respondents emphasised the highly skilled and complex nature of their work, expectations of additional unpaid hours, heavy workloads due to low staff numbers, and despite this low pay and poor conditions, particularly insecure short contracts.
I think that the government has yet to acknowledge how essential the community sector is in supporting the community. It’s disgraceful that the government continues to devalue us by failing to provide workplace stability and certainty of appropriate funding. (Senior manager, Disability services, NSW)
[The sector could be strengthened through] acknowledgement of the community sector as a professional industry to be appropriately remunerated in line with other professional industry bodies, eg social workers, public servants. It seems to be accepted that workers in the community sector will do additional unpaid hours on top of low remuneration and not questioned. This leads to burnout and low quality standards of services delivered, impacting on those who need the support. (Senior manager, Provider of multiple service types, Vic)
I could leave my role and work at Coles as a Bakery Manager and receive a higher salary than I do in my current role. I also was offered a role to work with young people and families post suicide intervention work and would be paid less than a Coles casual employee completing online shopping. [This shows] how undervalued and dismissed the community sector and social workers are and explains why retention of staff and turnover rates across the sector are so high. (Frontline worker, Financial, legal and emergency supports, Vic)
[We need] greater recognition of the workforce issues within community services… Underfunded, short-term contracts are rife in the sector, and we end up with a predominantly young workforce and people leave to work in better-paid sectors that have more flexibility as they become parents, sometimes returning in later years. (Project officer, Financial, legal and emergency supports, Qld)
Both leaders and workers argued for greater collaboration and networking across the sector to better meet community needs.
As a sector we can do a lot collectively rather than working in silos and ensure front line workers are given an opportunity to input. (Team leader, Provider of multiple service types, Qld)
Collaboration is the only solution. (CEO, Disability services, SA)
[We need] more interaction between support workers from different organisations. (Frontline worker, Housing and homelessness service, Qld)
Some leaders expressed concern about quality service provision in the sector. This has not been a strong theme in earlier iterations of the ACSS, and perhaps reflects the consequences of decades of underfunding and a stretched workforce. Certainly, some saw an opportunity to improve service quality by employing workers with higher skills on higher pay, and also called for reflection on organisational performance.
[The sector could be strengthened through] Professionalising the sector more to increase the quality of services, and increase the quality of workers attracted to the sector with better pay. (CEO, Children and youth services, ACT)
As a sector we need to lift our game and our advocacy should include an honest appraisal of our own performance in addressing disadvantage. (Senior manager, Provider of multiple service types, Vic)
Workers commented on the need for greater access to professional development and other training opportunities that are both affordable and relevant.
More free training, conferences that are relevant to our sector that don’t cost the earth. (Team leader, Community development service, Vic)
Better pay and training. (Team leader, Financial, legal and emergency supports, NT)
Additional low cost training and supervision opportunities. (Frontline worker, Housing and homelessness service, Qld)
5 Conclusion
Messages from the 1,476 frontline workers and leaders who participated in the 2022 ACSS are clear. Organisations and workers are struggling to meet rising levels of need in the community. The sector urgently needs adequate, and secure resources.
Participants told us that they are exhausted. They stay in the sector because they are committed to making a difference. They told us the ways their work is complex and important, requiring highly skilled and experienced staff who can support those members of our community experiencing difficult times. Yet trying to keep service provision going with too few staff, unpredictable funding and many hours of unpaid work is inevitably taking a toll. The sector needs governments to recognise the value of the work it contributes by funding it properly, including investing in decent wages, so workers can have security and stability in their lives, and provide high quality, sustainable supports to communities.
Sadly, sufficient funding to meet community need and provide decent pay is rare in Australia’s community sector. Leaders overwhelmingly reported that their organisation’s funding did not meet the full cost of service provision. Most were expecting funding to remain steady at this low level, or to decline in 2023. Most leaders were finding it more difficult to recruit staff. Sector workers, especially those in leadership roles, are contributing additional hours of unpaid work to keep their services running.
Since conducting this survey, some state and territory governments, including the ACT and Queensland, have made important announcements about indexation for some of their programs. The Queensland Government, for example, has doubled the indexation rate for community organisation funding to 5.07% and a review of indexation will inform future rates. The ACT Government has committed to a Sector Sustainability Program and improved indexation. These developments will hopefully go some way towards better maintaining real resourcing levels, however the sector desperately needs to see capacity bolstered significantly to ensure it can support the growing numbers of people in need.
Initiatives such as these should be carefully monitored and assessed to ensure they are genuinely effective in building sector capacity and sustainability. As a sector-led, sector-owned national data initiative, the ACSS is integral to such monitoring, helping to track change and understand what is needed to ensure the sector can more fully meet client and community need, to end poverty and inequality.
Appendix 1. Outline of methods and participants
Methods
Material in this report comes from the Australian Community Sector Survey, an initiative of the Australian Council of Social Service in partnership with the State and Territory Councils of Social Service and the Social Policy Research Centre.
Survey design was led by SPRC in partnership with ACOSS and the COSS network. Content was intended to capture current priorities of community sector workers and leaders (i.e. CEOs and senior managers) and information about their perceptions and experiences in the previous year. The survey instrument has been adapted each year to reflect current circumstances.
The research was approved by UNSW Sydney Human Research Ethics Committee (HC220506). The 2022 data was collected online via Qualtrics between September 5th and October 7th, 2022.
As there is no comprehensive national list of all relevant community sector organisations or staff from which to draw a representative sample, the team sought to reach respondents via COSS members, peak bodies, the Australian Services Union, websites and relevant social media, to ensure the widest possible reach. These organisations were asked to share the survey with organisations in their network, and to distribute the link to staff. In addition, the survey was sent to 672 workers who provided their email address when completing the previous year’s ACSS, for the purposes of being informed about future surveys. We sought to encourage participation by offering an incentive in the form of an opportunity to go into the draw to win shopping vouchers.
A separate module of questions was asked of organisational leaders only (CEOs and senior managers) to capture issues for the service overall, including on issues of funding, indexation, and recruitment and retention.
A companion report to this one, which also uses the 2022 data, focuses on levels of demand experiences trying to meet need.
About participants
In total, 1,476 community sector staff completed the survey during September 2022.
Roles
Among participants were:
- 318 organisational leaders, consisting of 169 CEOs and 149 senior managers;
- 386 co-ordinators or team leaders;
- 560 frontline practitioners;
- 109 policy, project and research staff;
- 75 staff providing office support and central services; and
- 28 staff with other roles.
Type of organisations
Most survey participants (57%) were in organisations focused on directly delivering services and supports to service users and communities (see (Figure A. 1). Around a fifth (21%) were in peak bodies, and 20% were from other member-based or representative organisations, which represented or advocated for particular populations, communities or groups.
Figure A. 1 Type of community sector organisation
Gender
Most survey participants were women (69%), including CEOs (68% of whom were women) and frontline workers (69% were women). However, the gender profile of participants differed across types of organisations:
- 76% of participants from service-delivery focused organisations were women, compared with 59% of those from peak bodies and 57% of those from other member-based or representative organisations (Figure A. 2).
- Women constituted very high proportions of participants who were focused on domestic and family violence services and other services for families (85%), and those focused on financial, legal and emergency supports (81%) (see Appendix 2, Table A. 1).
- Men comprised 45% of participants from organisations focused on ageing and carers, and 40% of those focused on employment, education and training, but in no subsector did men comprise the majority of participants (Appendix 2, Table A. 1).
Figure A. 2 Participants’ gender, by type of organisation
Contact with clients
Survey participants were closely engaged with clients and communities. Virtually all frontline workers (99%) and the vast majority of team leaders and co-ordinators (93%) were in regular, direct contact with clients and service users (Figure A. 3), including either face-to-face or physical contact, or contact over the phone or online. Contact with service users usually took place in a community service facility, such as a community centre, neighbourhood centre, community health or legal centre, youth centre, or community or church facility. These were the main service settings, reported by 70% of those with regular, direct contact with service users, while 29% had contact with service users in an office, and 19% had contact in the homes of service users (see Appendix 2, Table A. 2).
Many senior, managerial staff work closely with service users. Indeed, 56% of CEOs and 46% of senior managers reported having regular, direct contact with service users. This was much more common in small organisations:
• Of CEOs and senior managers in organisations with less than 20 paid staff, 64% had regular contact with service users, compared with only 38% of those in organisations with 100 or more staff (Figure A. 4).
This reflects the particular strength of small organisations in working closely with communities, with organisational leaders being more engaged with and accessible to service users than in larger organisations.
Figure A. 3 Participants who have regular, direct contact with clients and/or service users, by role
Figure A. 4 Proportion of CEOs and senior managers who have regular direct contact with service users, by size of organisation
Appendix 2. Supplementary Data
Table A. 1 Proportion of women in each main service category
Table A. 2 Settings where participants had contact with service users
Note: Percentage is a percentage of the 1160 participants who reported having regular direct, contact with service users.
Table A. 3 Number of funding types reported by organisational leaders
Table A. 4 Average number of funding types, for small, medium and large organisations
Table A. 5 Types of funding received by the organisation
Table A. 6 Leaders’ reports of change in organisations’ financial position, 2021 and 2022
Table A. 7 Proportion of leaders who reported their organisation has at least one 5-year contract, by main source of funding
Table A. 8 Whether or not the organisation has at least one contract, grant or funding agreement with government which is five years or longer in duration, by main funding source and jurisdiction
Table A. 9 Responses to the question “How would you rate staff turnover in your organisation in 2022?”, by size of organisation
Table A. 10 Where staff plan to be working in 12 months, by role
Table A. 11 Agreement with statements about working in the community sector, by role
Table A. 12 Hours of paid and unpaid work, by role
Table A. 13 Hours of paid and unpaid work, by size of organisation