Click here to download the document
Acknowledgements
This report is an output of the Australian Community Sector Study 2022, commissioned by the Australian Council of Social Service and the Councils of Social Service in partnership with Bendigo Bank, Australia’s better big bank. We warmly thank the community sector staff who participated in the Australian Community Sector Survey, and generously shared their experience and insight. We thank Rob Sturrock and Penny Dorsch from ACOSS, and the ACSS Steering Group for thoughtful guidance throughout, along with Dani Previtera from ACOSS and Isabella Nahon from ACOSS/UNSW for assistance with promotion of the survey.
A/Prof Natasha Cortis and Dr Megan Blaxland
© Australian Council of Social Service
Suggested citation:
Cortis, N. and Blaxland, M. (2022) Helping people in need during a cost-of-living crisis: findings from the Australian Community Sector Survey, Sydney: ACOSS.
Foreword
The findings of this report illustrate two collective experiences during 2022 – people living in poverty, disadvantage and hardship increasingly seeking help with the essentials of life, and the community service providers stretched ever more thinly in their determination to assist as best as possible but being pushed too far.
Exacerbating three years of the pandemic and continuous natural disasters was the emergence of significant inflationary pressures affecting the community. Costs such as housing, food and energy rose rapidly. Income support payments remained below the poverty line. This confluence of factors pushed people in need, and the workforce helping them, beyond breaking point.
These cost-of-living pressures led to even more intense housing pressures. For those escaping family and domestic violence, or seeking emergency assistance after disasters, access to affordable housing was a common challenge, with minimal short-term relief. Surging requests for shelter from some of our most vulnerable people overwhelmed housing and homelessness services. As the report clearly reveals, a sense of being overwhelmed was a regular, if not typical, situation for providers.
Community services are some of the most resourceful, hard-working and dedicated organisations in our society. As this report shows, they are able to traverse disasters, innovate and update their service offerings to ensure that as many people as possible can receive help in a timely and impactful way.
Service providers did their best to deal with rising operational costs and staffing shortages. This added extra pressure on service delivery capacity, and on the health and wellbeing of frontline staff. Despite incredible efforts, the services struggling the most are the ones most at risk of losing staff.
Service providers are not only grappling with their own capacity to assist people, but increasingly concerned about the inability of the service system as a whole to meet community need. An array of service networks is overwhelmed and overworked, trying to manage enormous levels of demand from people trying to navigate dire daily circumstances. Some providers are moving more services to online, or offering support in groups rather than individually, to keep up with demand. Others are seeing wait lists increase or close entirely, referring people to other equally overstretched, or turning people away altogether.
The sector’s remarkable resilience should be applauded. But applause on its own is insufficient. Ours is about the last sector in Australia expected to provide a service without sufficient resources for administration, workforce pay, conditions and development, and other major overheads.
There is a clear path forward to reversing the above trends. Government must fund community organisations to both operate at full effectiveness, and ably meet people’s demand for help without burning out the workforce. Concurrently, it must invest more in our systems and supports to reduce the overall number of people needing help. This means boosting income support levels to a more dignified, fair level, building more social housing and ensuring people can access meaningful employment and necessary training.
We are regularly reminded by government that Australia faces tough fiscal circumstances and that we must be disciplined in public expenditure. These circumstances mean we must re-order government priorities to things that matter the most and provide the best social and economic benefit. Ensuring people who need help the most can rebuild their lives should be at the top end of our national priorities list.
Recommendations
In the near six months since coming to office, the Federal Government has acted purposefully to begin implementing its election commitments to the sector.[1] In the context of this report, the most important action is the supplementary financial assistance measure, worth $560 million over four years, delivered in the October 2022 Federal Budget for community service organisations affected by increasing wage, superannuation bills, as well as high inflation. The government has also acted to remove or nullify advocacy gag clauses in Commonwealth contracts[2] and is looking into extending contracts for longer timeframes for grants ceasing in the 2022-23 financial year.[3] These are positive steps, but must be only the first on a pathway to deeper structural reform.
The sector requires better investment and development to meet rising, complex community need. Given that, ACOSS recommends the following sector policies to the Federal Government:
- Fund the full cost of service delivery, including infrastructure, management, workforce development and administration costs in all Commonwealth grants and contracts for community services.
- Apply equitable and transparent indexation to all grants and contracts for community sector organisations, that reflects the actual increase in costs incurred by funded organisations. Ensure providers are notified in a timely manner and rates are published annually.
- Undertake a comprehensive service needs analysis to better understand community need for services, drivers behind changing need and gaps in the funding of service delivery. This analysis should inform investment decisions made by government.
Cassandra Goldie, ACOSS CEO
[1] Macallister, J. (2022) Restoring Respect for the Community Sector – Speech to ASU members, Blaxland. https://www.jennymcallister.com.au/speech_to_asu_members_blaxland_restoring_respect_for_the_community_sector
[2] Karp, P. (2022) “Federal Labor removes gag on legal aid centres that banned political advocacy” The Guardian, 29 November 2022. https://www.theguardian.com/australia-news/2022/nov/29/federal-labor-removes-gag-on-legal-aid-centres-that-banned-political-advocacy
[3] Rishworth, A. (2022) Australian Services Union NSW / ACT Social and Community Services Council Speech 2022, 11 August 2022. https://ministers.dss.gov.au/speeches/8766
1 Executive Summary
This report examines changes in community need, and the ways community sector organisations and staff have responded.
Data comes from the Australian Community Sector Survey, which was conducted in September 2022 by the Social Policy Research Centre at UNSW Sydney, in collaboration with the Australian Council of Social Service (ACOSS) and the network of Councils of Social Service of Australia (COSS Network), supported by Bendigo Bank.
The survey was completed by 1,476 community sector staff from a range of different roles. Among them, were 318 organisational leaders (169 CEOs and 149 senior managers); 386 co-ordinators or team leaders; 560 frontline practitioners; 109 policy, project and research staff; 75 staff providing office support and central services; and 28 participants with other roles. Information about participants and the survey method is in Appendix A.
Overall, the report’s findings show rising levels of community need and shortages of capacity to meet demand for community services during 2022 – the third year of the COVID-19 pandemic and a time of intensifying financial, housing, and other pressures affecting communities. These are detailed below.
A further report exploring sector funding, workforce and other issues that affect sector capacity to meet need, and which also draws from the Australian Community Sector Survey, will be released in 2023.
1.1 Key findings
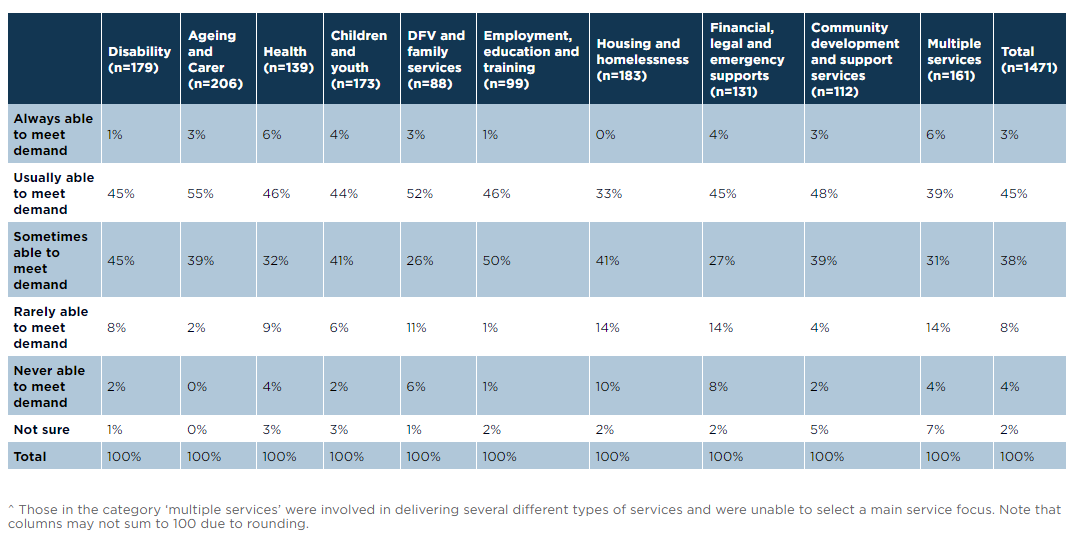
Only 3% of participants said their main service could always meet demand.
This highlights the impact of escalating costs of living combined with increasing financial distress, in which organisations are struggling to meet growing and intensified needs of communities.
People and providers commonly faced acute cost of living and housing pressures in 2022
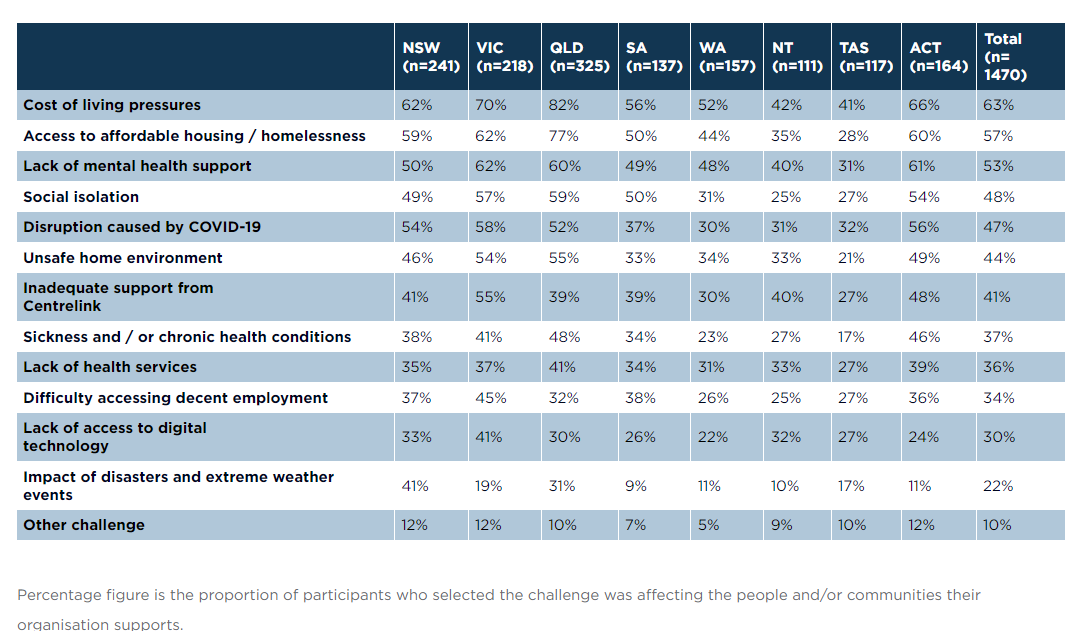
- 63% of survey participants reported that cost of living pressures affected the people/communities their service supports. This was the most frequently reported challenge affecting services in all jurisdictions.
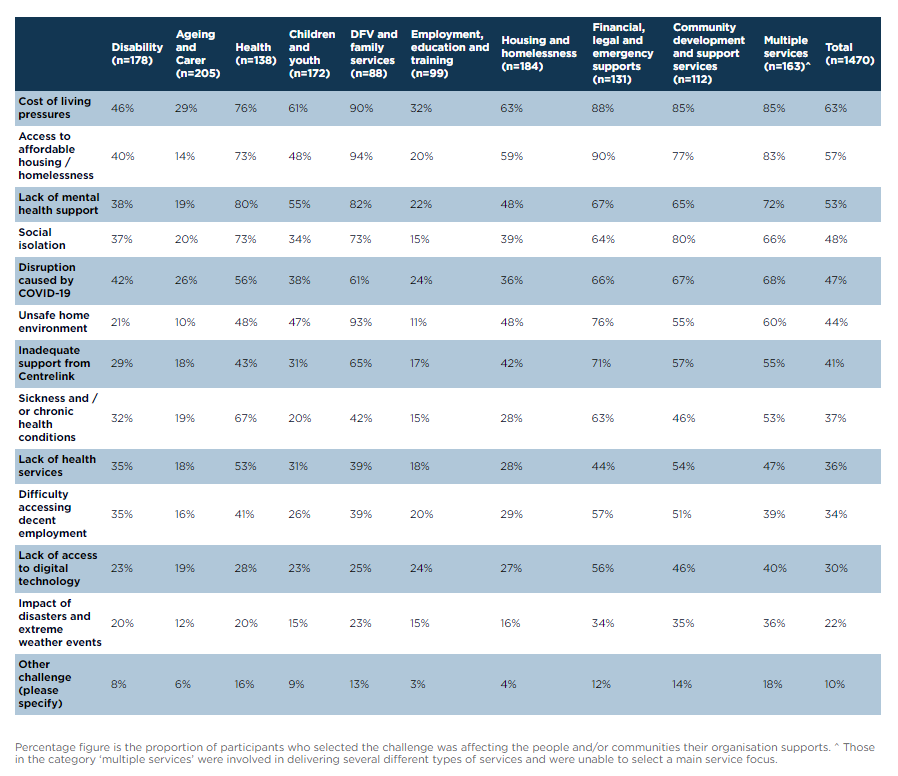
- 57% of participants said access to affordable housing, or homelessness, affected their service users and communities, but this was much higher among providers focused on domestic and family violence (94%) and financial, legal and emergency supports (90%).
- Lack of mental health support, social isolation, and disruption caused by COVID-19 have also been major issues.
[perfectpullquote align=”full” bordertop=”false” cite=”” link=”” color=”#446681″ class=”” size=”12″]In almost thirty years in community service provision, I have never experienced a more challenging environment. (CEO, Child and youth services, Vic)[/perfectpullquote]
Participants reported that poverty, disadvantage and complexity of need increased, especially for those escaping family violence
Consistent with the acute housing, cost of living and other pressures affecting people and communities, Australia’s community sector continues to contend with rising disadvantage and complexity of need.
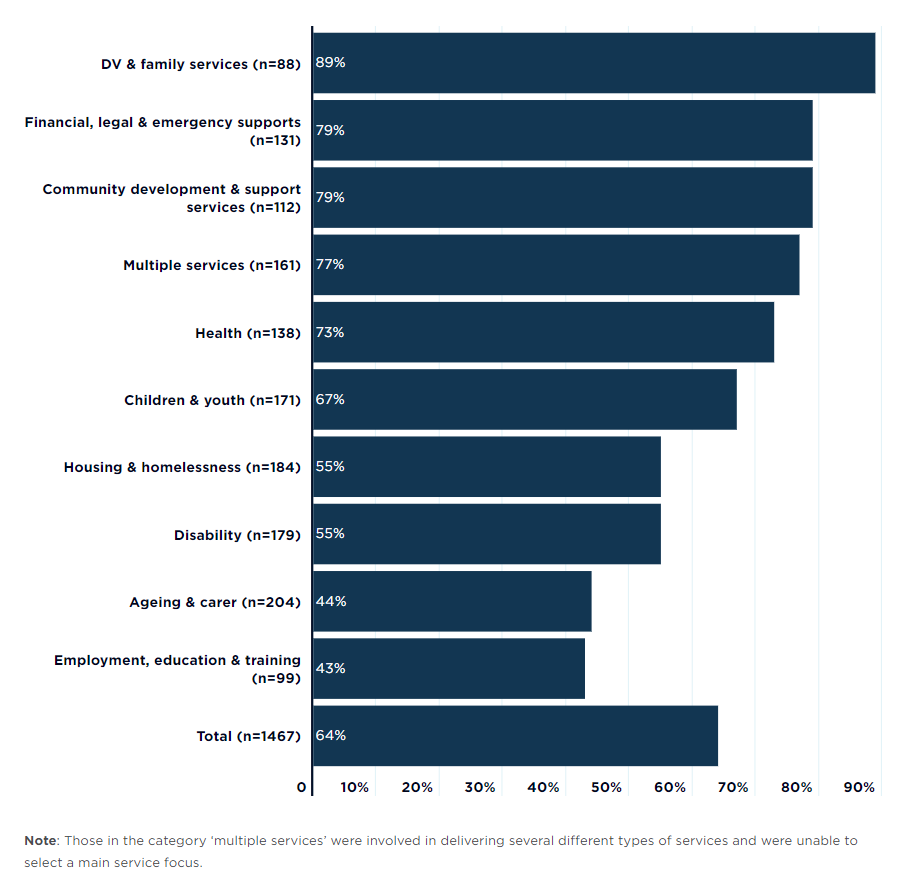
- Increased complexity of need was reported by nearly two-thirds of participants (64%). This trend was particularly common among those delivering domestic and family violence and other family services (89%).
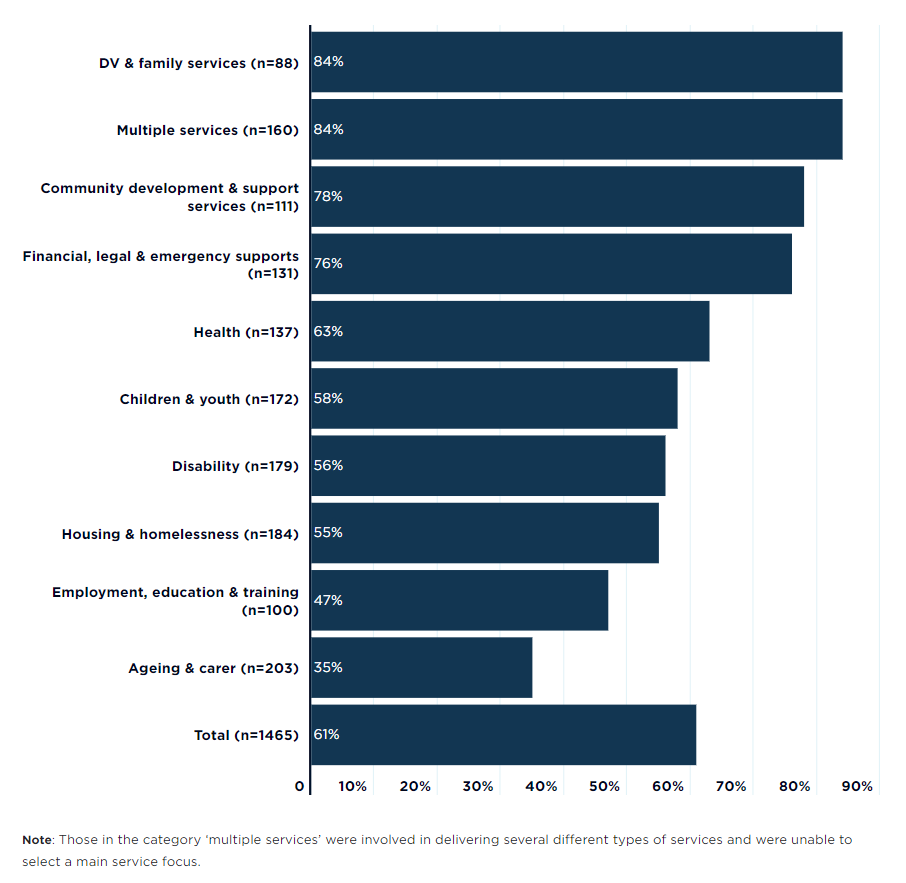
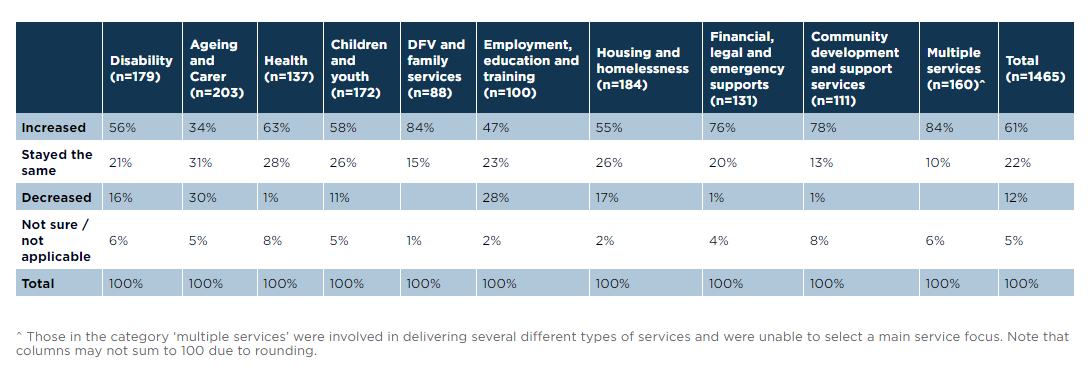
- Three in five participants (61%) reported increased levels of poverty and disadvantage among their clients and community members. Among those focused on domestic and family violence, and other family services, a very high proportion of participants reported rising levels of poverty and disadvantage (84%).
Service demand continues to rise, and capacity to meet it is scarce
Most participants observed increased demand for services.
When asked if levels of demand for their main service had increased, decreased or stayed the same this year, two-thirds reported increases (66%).
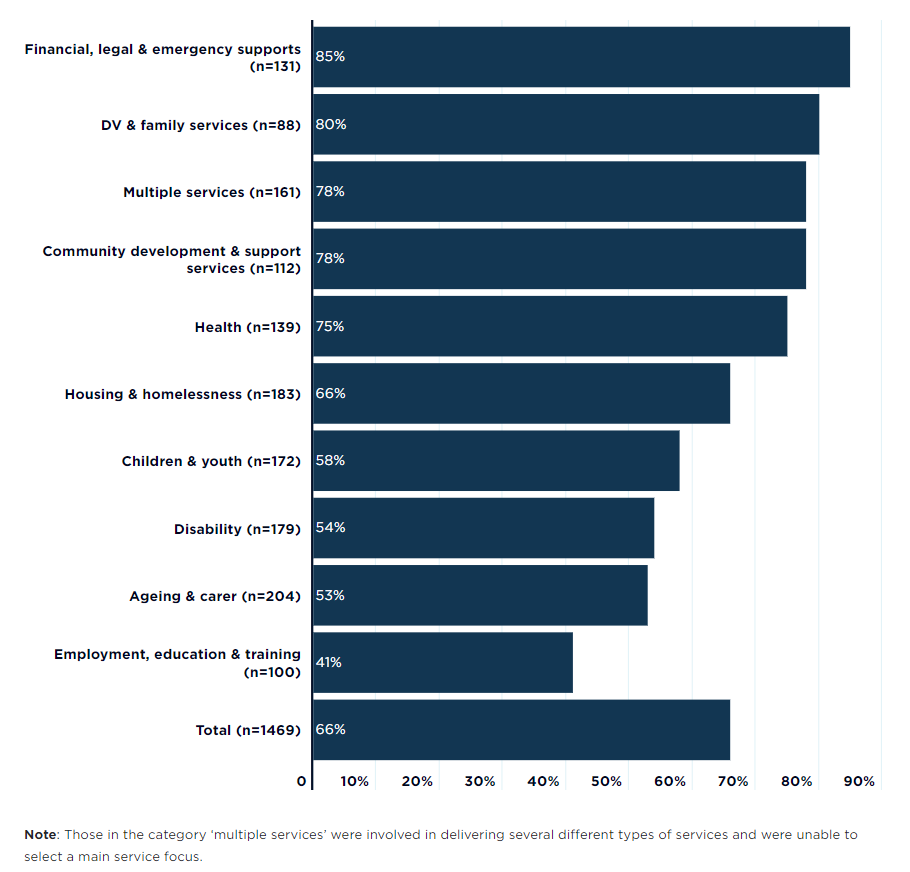
A very high proportion of those delivering financial, legal and emergency supports reported increases in demand (85%), as did those focused on domestic and family violence and other family services (80%).
Around 4 in 9 participants (44%) reported that their main service had seen increases in numbers of clients they were unable to support.
Problematically, many participants observed inadequate capacity not only in their own service, but throughout related networks.
[perfectpullquote align=”full” bordertop=”false” cite=”” link=”” color=”#446681″ class=”” size=”12″]”We are underfunded and understaffed to meet the increasing needs.” (Frontline worker, DVF and family services, Qld)[/perfectpullquote]
Few services have been able to consistently meet demand this year, especially those helping people find homes and shelter.
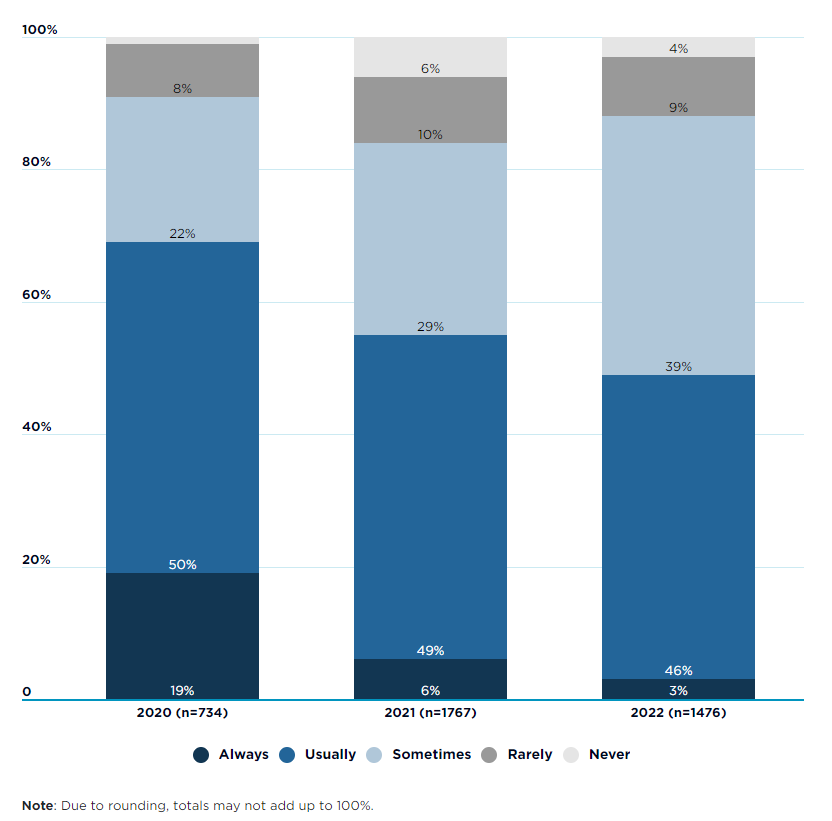
In 2020, when many income support recipients were temporarily better off due to the Coronavirus Supplement, 19% of ACSS participants said that the main service they worked for was ‘always’ able to meet demand. However, in 2021 after the Supplement was withdrawn, this plummeted: only 6% of participants said their main service could ‘always’ meet demand. This year’s figure shows only 3% said their main service was ‘always’ able to meet demand.
Housing and homelessness services are particularly stretched. Among the 180 participants who were focused on housing and homeless, none reported that their service could ‘always’ meet demand. Only a third (33%) reported being ‘usually’ able to do so. Among housing and homelessness sector workers, one in 10 (10%) reported ‘never’ being able to meet demand, compared with 4% among all participants.
[perfectpullquote align=”full” bordertop=”false” cite=”” link=”” color=”#446681″ class=”” size=”12″]”We are unable to support all the referrals or enquiries we receive due to lack of capacity or brokerage.” (Frontline worker, Housing and homelessness service, Qld)[/perfectpullquote]
Pressures are taking a toll on clients and staff
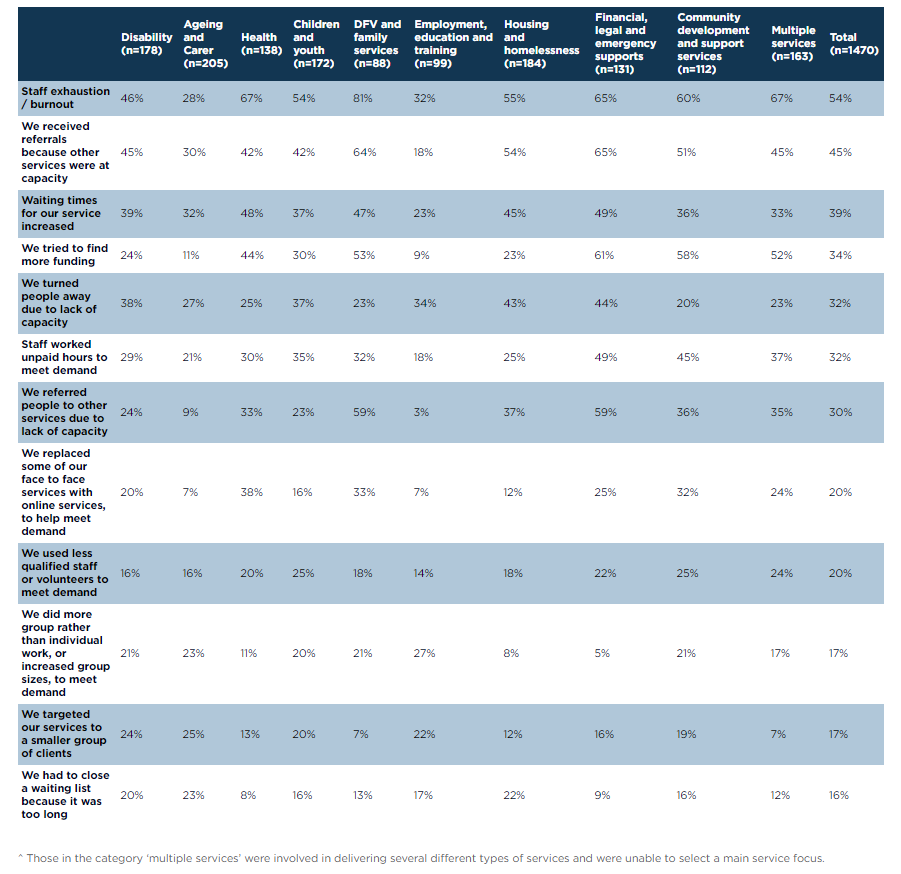
When participants were asked about the ways their service had responded to increased demand, many reported doing so in ways that would minimise adverse impacts on clients, such as by seeking more funding (34%), staff working additional unpaid hours (32%), using less qualified staff or volunteers (20%), or doing more group rather than individual work (17%).
[perfectpullquote align=”full” bordertop=”false” cite=”” link=”” color=”#446681″ class=”” size=”12″]”Our resources are being stretched to their limits whilst we try to keep up with increasing demand.” (Team leader, Community development service, NSW)[/perfectpullquote]
Such organisational responses, however, were less than ideal, and have implications for both clients and staff, and governments that invest in service provision. Years of chronic under-investment in the sector shows providers are at the point when they can no longer do ‘more with less’ and maintain an effective continuity of care for people requesting help.
This is clearly evidenced in the following responses from survey participants, when asked about service capacity:
- 2 in 5 (39%) of participants said waiting times for their service had increased (39%).
- A third (32%) said their service had turned people away due to lack of capacity.
- 30% reported referring people to other services due to lack of capacity.
- 16% said their main service had to close a waiting list, as it was too long.
Staff have been pushed beyond their limit.
54% of participants said their main service was affected by staff exhaustion or burnout. This was very high among those focused on domestic and family violence and other family services (81%).
Staff exhaustion or burnout was much more common in the most stretched services, where meeting demand was particularly difficult.
Genuine commitment by governments is needed to meet community need through increased investment in services, especially those accessed by people in crisis.
Participants highlight the mismatch between funding levels and community need for services.
Among 300 CEOs and senior managers, only 1 in 8 (12%) agreed with the statement “Funding enables us to meet community demand”.
As well as inadequate funding, workforce shortages are a major impediment to service capacity.
Two in five participants (40%) said their main service or program was unable to recruit the staff that were needed.
36% said they faced difficulties finding volunteers. Recruitment difficulties are disproportionately high in services unable to meet demand. This reflects the ways staffing gaps constrain capacity, but also that working in overstretched services makes it more difficult to attract prospective staff.
[perfectpullquote align=”full” bordertop=”false” cite=”” link=”” color=”#446681″ class=”” size=”12″]”Funding from governments is drying up given the budget deficits from COVID but demand for social support continues to increase. There is little consideration to the viability and sustainability of the third sector in Australia by governments.” (CEO, Multiple services, NSW [/perfectpullquote]
2 Communities face acute daily living pressures
The survey data clearly highlights the multiple, daily pressures people experienced in trying to afford basic living costs, find suitable shelter and access services for help. In addition to people on income support, providers shared examples of people with paid jobs struggling with the costs of daily life and seeking assistance from different services, in the context of acute cost of living pressures.
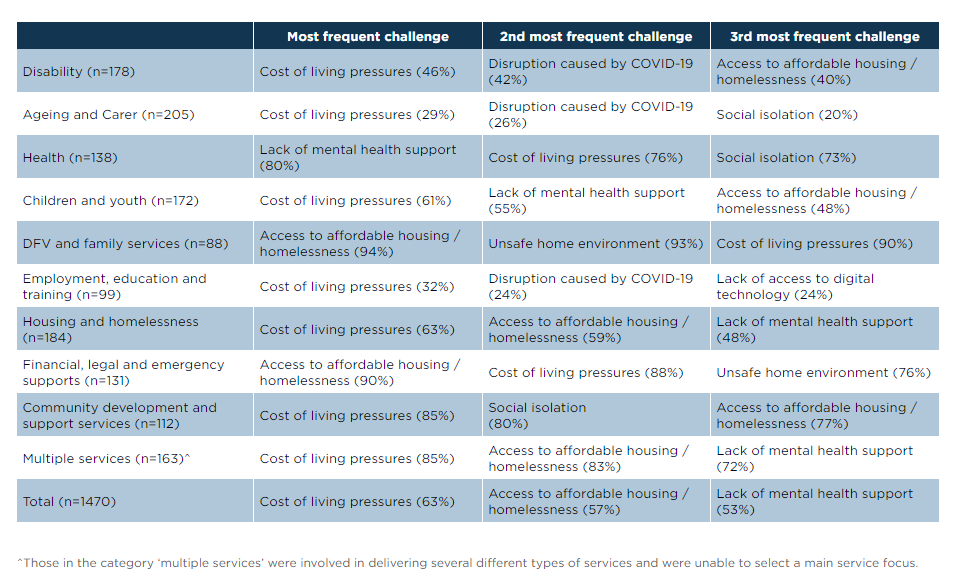
Respondents consistently identified cost of living pressures as the main challenge faced by people using community services throughout the year. A total of 63% of survey participants identified this challenge overall (Figure 2.1). It was also the most reported challenge in each state and territory (Appendix B, Table B. 1). In each service type, it was identified in the top two identified challenges affecting service users and communities (Table 2.1 and Table B. 2).
Respondents also flagged the continued mental strain affecting people and communities, who were contending with lack of mental health support, social isolation, and ongoing disruption caused by COVID-19.
Data on household incomes from the Australian Bureau of Statistics (ABS) shows that one in eight people and one in six children in Australia lived in poverty prior to the pandemic.[4] Australia’s substantial poverty alleviation efforts throughout 2020-21 financial year were positive but short-lived, and did not ultimately reduce poverty rates for very long.[5] In the 12 months to September 2022, the Consumer Price Index (CPI) rose by 7.3%, with significant price rises in housing (10.5%), transport (9.2%), and food (9%, including 10% rises for bread and 16.2% for fruit and vegetables).[6] Recent research with people using community services in Victoria and Tasmania found 92% had cut back on food and groceries, 70% were unable to eat well, and two-thirds reported pressure from rising energy costs, during 2022.[7] A national survey showed that in 2022, 62% of parents and carers were finding it harder than previously to afford basic school-related such as lunches, uniforms and excursions, due mainly to rising costs of groceries, rent and petrol.[8]
Figure 2.1 Challenges affecting people and/or communities supported in 2022
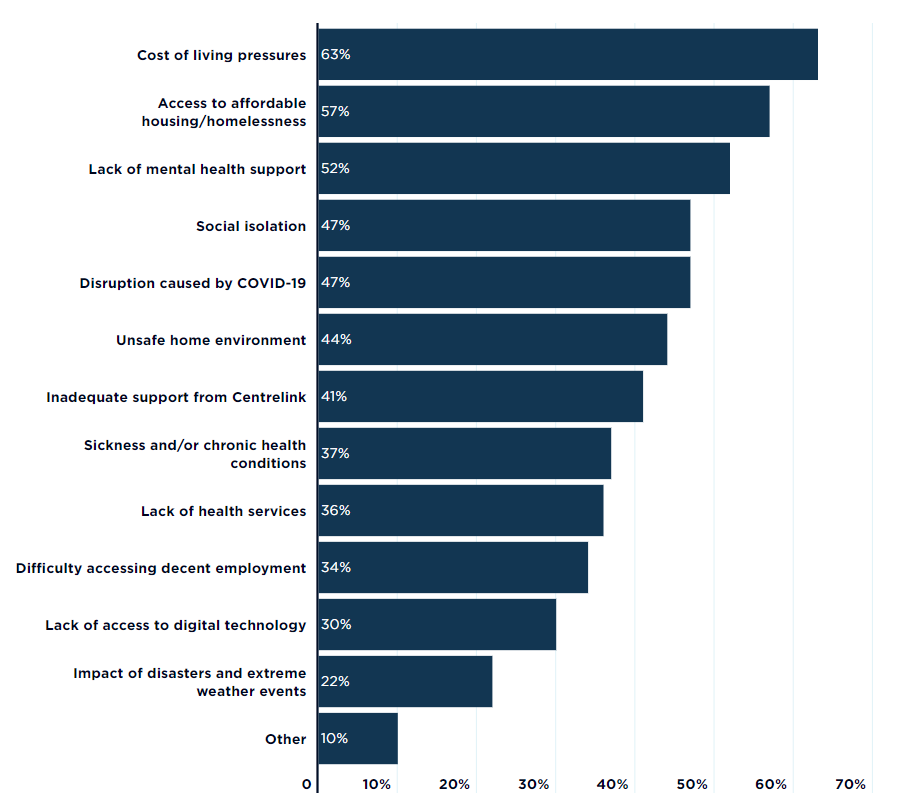 Table 2.1 Challenges affecting service users and communities, by main service
When commenting on the pressures faced by the communities they support, respondents overwhelmingly identified increased living costs, particularly housing, as the most common issue. One participant responded, ‘Affordable housing, housing, housing.’ (Senior manager, DFV and family services, SA). A participant providing financial, legal or emergency supports detailed their community’s intersecting challenges of increased costs of housing and other essential items, limited access to support services, and persistently low rates of income support payments:
[perfectpullquote align=”full” bordertop=”false” cite=”” link=”” color=”#446681″ class=”” size=”12″]”I am seeing clients who are struggling to live day to day due to rising interest rates, rents and everyday cost of living increases including food and petrol. People on moderate incomes are accessing emergency relief and food banks because they cannot afford groceries. They are extremely stressed and overwhelmed and cannot access adequate mental health supports to assist them with the anxiety and stress that comes with financial difficulty. Clients are turning to unsuitable loan products and buy-now-pay-later products to get by, landing them in further debt and financial difficulty. Clients who are on Centrelink income support struggle even more.” (Frontline worker, ACT, financial, legal and emergency supports)[/perfectpullquote]
Many other workers explained similar situations, for example:
[perfectpullquote align=”full” bordertop=”false” cite=”” link=”” color=”#446681″ class=”” size=”12″]”The situation for many of our clients (particularly those with the least) faced with unaffordable housing, food, transport, medical bills, and no prospects of a job, is dire. Our member organisations have never been busier – following multiple disasters the inevitable tsunami of need (emergency relief and severe financial distress; mental health; family and domestic violence; housing and homelessness – including lack of tradies & building materials; youth suicide and children impacted in their mental health and schooling) have all been amplified by surging costs of living and house/rent prices and ‘below the poverty line’ Centrelink payments (even aged pensioners are struggling).” (CEO, Peak body, NSW)[/perfectpullquote]
Problems with housing availability were particularly acute in some regional areas.[9]
[perfectpullquote align=”full” bordertop=”false” cite=”” link=”” color=”#446681″ class=”” size=”12″]”Affordable housing has become far and away the biggest issue for our general client cohort. Many have been evicted, received huge rent rises, been forced into homelessness, have large rent arrears, can’t find affordable housing anywhere and are often paying well beyond their means. (Team leader, Financial, legal, emergency supports, Vic) Massive impacts from lack of affordable housing. Strong and broad negative impacts caused by increases in daily living costs and rent increases. Also people having their lease not renewed and that property re-leased at a far higher rent.” (Office support, Mental health services, SA) [/perfectpullquote]
[4] Wilson, E; Churchus, C; and Johnson, T (2022) ‘Can’t afford to live’. The impact of the rising cost of living on Victorians and Tasmanians on low incomes. Melbourne, Uniting (Victoria and Tasmania). https://www.unitingvictas.org.au/wp-content/uploads/FINALCant-afford-to-live-report_web-version-embargoed-until-19.10-1.pdf
[5] The Smith Family (2022) The Smith Family Pulse Survey, https://www.thesmithfamily.com.au/media/research/reports/pulse-survey-october-2022
[6] Davidson, P; Bradbury, B; and Wong, M (2022) Poverty in Australia 2022: A snapshot Australian Council of Social Service (ACOSS) and UNSW Sydney. https://povertyandinequality.acoss.org.au/wp-content/uploads/2022/10/Poverty-in-Australia-2020_A-snapshot_print.pdf
[7] Davidson, P; Bradbury, B; and Wong, M (2022) Poverty in Australia 2022: A snapshot Australian Council of Social Service (ACOSS) and UNSW Sydney. https://povertyandinequality.acoss.org.au/wp-content/uploads/2022/10/Poverty-in-Australia-2020_A-snapshot_print.pdf
[8] Australian Bureau of Statistics (2022) Consumer Price Index, Australia, September Quarter 2022, https://www.abs.gov.au/statistics/economy/price-indexes-and-inflation/consumer-price-index-australia/latest-release
[9] Pawson, H., Martin, C., Thompson, S., Aminpour, F. (2021) ‘COVID-19: Rental housing and homelessness policy impacts’ ACOSS/UNSW Poverty and Inequality Partnership Report No. 12.
3 More people are experiencing financial distress and disadvantage, and have increasingly complex needs
Australia’s community sector continues to report rises in poverty, disadvantage, and complexity of need amongst people seeking help. These have followed very large increases observed by the community sector in 2021.[10]
In total, three in five participants reported increased levels of poverty and disadvantage (61%) among clients and communities. Reports were far higher for respondents delivering domestic, family violence, and other family services (84%), community development and support services (78%) and financial, legal and emergency supports (76%) (Figure 3.1, for full data see Table B. 3).
[perfectpullquote align=”full” bordertop=”false” cite=”” link=”” color=”#446681″ class=”” size=”12″]”In these communities, members are overwhelmed by the complexity of the issues they are facing. Every client has multiple issues which need to be addressed this can affect a person’s ability to engage as there may be other more pressing issues or health issues.” (Frontline worker, Financial support, Vic)[/perfectpullquote]
Figure 3.1 Proportion of participants who reported increased levels of poverty and disadvantage in the community in 2022, by main service
Note: Those in the category ‘multiple services’ were involved in delivering several different types of services and were unable to select a main service focus.
Nearly two-thirds of participants reported increasingly complex needs (64%) among the people and communities their services support. Again, this was particularly high among those delivering domestic, family violence, and other family services (89%), financial, legal and emergency supports (79%) and community development and support services (79%) (Figure 3.2, see also Table B. 4).
[perfectpullquote align=”full” bordertop=”false” cite=”” link=”” color=”#446681″ class=”” size=”12″]”Our clients are presenting with more complex/intersectional needs than in previous years.” (Board member, Population specific support service, ACT)[/perfectpullquote]
Figure 3.2 Proportion of participants who reported increased complexity of need in 2022, by main service
Note: Those in the category ‘multiple services’ were involved in delivering several different types of services and were unable to select a main service focus.
[perfectpullquote align=”full” bordertop=”false” cite=”” link=”” color=”#446681″ class=”” size=”12″]”Everything has increased: numbers of clients, complexity of need and legal issues experienced by clients, and ability to staff/volunteer services to meet the need. The funding has somewhat stayed the same, but for some additional federal funding regarding COVID-19, however, the competitive funding environment makes it difficult for frontline services and there is simply not enough funding (or the funding is too slow).” (Policy officer, Legal services, Qld)[/perfectpullquote]
[10] Cortis N and Blaxland, M (2021) Meeting demand in the shadow of the Delta outbreak: Community Sector experiences. Demand Snapshot 2021. Sydney: ACOSS. https://www.acoss.org.au/wp-content/uploads/2021/12/Demand-snapshot_ACSS-2021_v3.pdf
4 People’s demand for services keeps rising
The responses from survey participants indicates that most services have faced increased demand pressures during 2022. Few find they can consistently meet the high level of need in the community.
4.1 Few services can always meet demand
Participants’ responses to questions about whether they can meet community demand for help clearly highlight the strain on community services, and the multiple, connected challenges facing people experiencing poverty and disadvantage.
Less than half of all respondents reported that their main service could ‘usually’ or ‘always’ meet demand.
In 2020, 19% of ACSS participants said that their main service was ‘always’ able to meet demand. This response was at a time when many income support recipients were temporarily better off due to the Coronavirus Supplement. In 2021, after the Supplement was withdrawn, only 6% of participants said their main service could ‘always’ meet demand. By September 2022, this figure had dropped to just 3% of participants reporting their service could ‘always’ meet demand.
In 2022, 46% of respondents said their main service could ‘usually’ meet demand, down slightly from 49% last year. Additionally, 13% of respondents reported their main service was ‘never’ or rarely’ able to meet demand, down from 16% last year (Figure 4.1).
Figure 4.1 Ability to meet demand in 2020, 2021 and 2022
Respondents that identified housing and homelessness as their main service reported even greater difficulty in meeting community demand, with none saying they could ‘always’ meet demand. Only 33% reported being ‘usually’ able to do so. Among housing and homelessness workers, one in ten reported ‘never’ being able to meet demand, compared with 4% across all participants (Table B. 5).
Participants in a wide range of roles, in various locations and delivering different services wrote moving accounts of being unable to meet demand for help.
It is well noted that no organisation had sufficient capacity to meet community need during 2022. With the pandemic and floods it has escalated the need for social housing and emergency housing in the area. (Office support worker, Housing and homelessness service, NSW)
Most local community service organisations are so poorly funded, they cannot meet need. Eligibility criteria for mental health programs for our young people, for example, are so restrictive and government services so underfunded, that young people are turned away…Late last year our youth services surveyed our young people, and 93+% had had suicidal ideation in the past 12 months, but there are no services to deal with that level of need. (CEO, Provider of multiple service types, NSW)
Keeping aged care services in remote areas was impossible even prior to COVID, now it is a crisis and the crisis is spreading throughout the aged care and health workforce. (Policy officer, Ageing service, ACT)
As a peak and main advocacy body…we are severely under resourced and funded – often we cannot meet the needs of our members particularly in the policy and advocacy space. (CEO, Peak body, WA)
4.2 Services are grappling with rising demand
When asked if demand for their main service had increased, decreased or stayed the same, two-thirds of participants (66%) reported that levels of demand for their main service had risen in 2022 (Figure 4.2, see also Table B. 5). In nine out of ten service areas, a majority reported seeing an increase in demand amongst communities. The proportion of respondents reporting increased demand was highest among those delivering financial, legal and emergency supports (85%) as well as those providing domestic and family violence, and other family services (80%).
Figure 4.2 Proportion of participants who reported increased levels of demand for their main service in 2022, by main service type
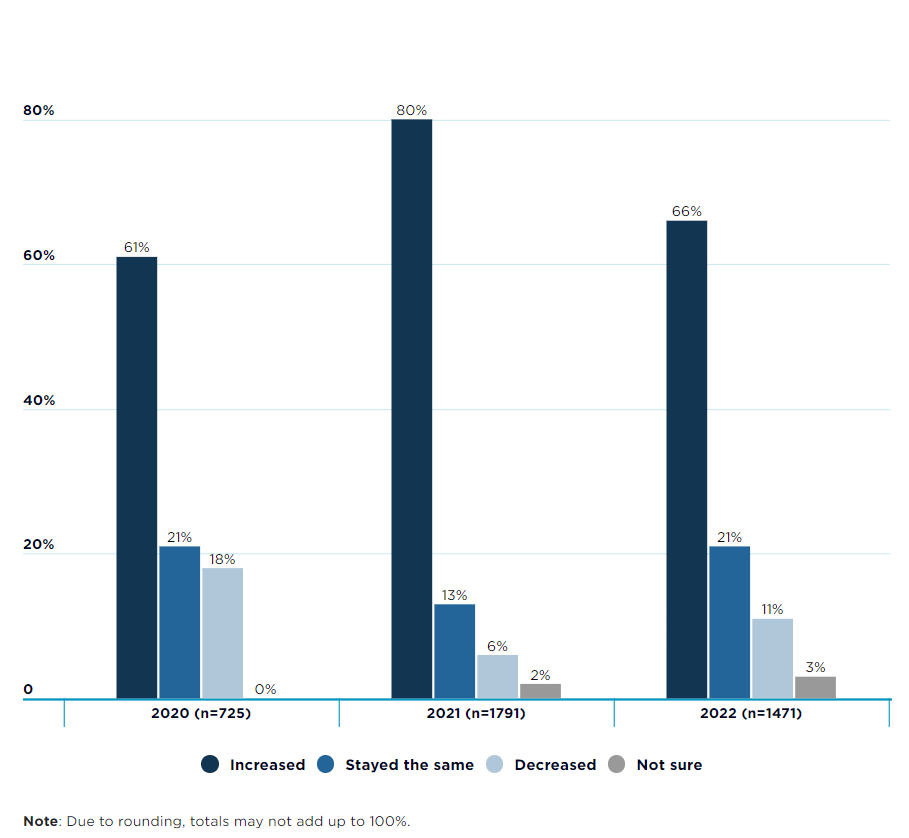
The cumulative impact of the past three years of challenges continues to be felt by the community sector in 2022. Participants reporting an increase in demand this year comes after 80% of previous participants reported increases in demand last year (Figure 4.3). In 2022, a higher proportion of respondents respectively reported that demand remained stable (21%), and demand had fallen (11%), reflecting some improvement on the upheavals experienced in 2021.
Figure 4.3 Whether demand increased, stayed the same or decreased, 2020 to 2022
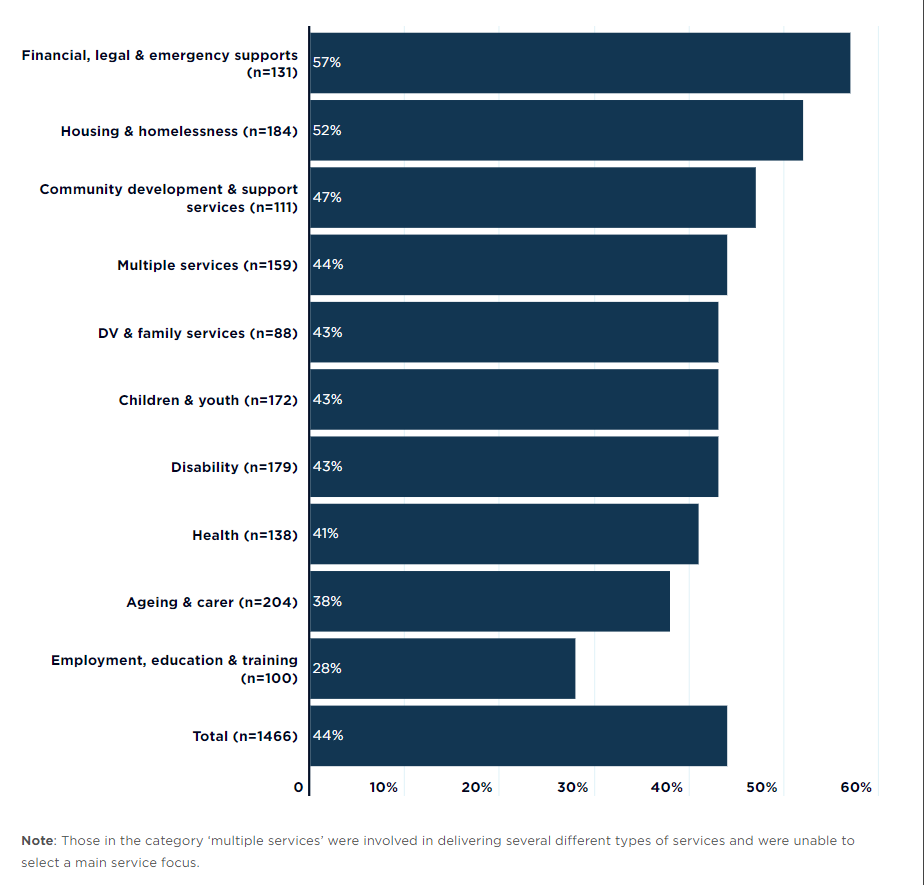
With substantial increases in demand, around 4 in 9 participants (44%) reported that during 2022, their main service had seen increases in the numbers of people they were unable to support (Figure 4.4, see also Table B. 6). Incapacity to support people needing help was particularly evident for those delivering financial, legal and emergency supports (57%), and in housing and homelessness services (52%).
Figure 4.4 Proportion of participants who reported increases in numbers of clients the service could not support in 2022, by main service type
Many participants found that inadequate capacity was evident not only in their own service, but throughout their networks. Indeed, 45% of participants said their service received referrals because other services were at capacity. This was particularly high for financial, legal and emergency services (65%) and domestic and family violence services (64%) (see Table B. 7). It was also higher among those delivering services in the capital cities (58%) compared with those supporting regional, rural or remote communities (42%).
Concerningly, providers receiving referrals from other services already at capacity were often themselves unable to accommodate new users. Of those who received referrals from at-capacity services, 18% were also ‘rarely’ or ‘never’ able to meet demand. The survey highlights the need for investment in expanding capacity across service networks, to reduce the number of people at risk of being shifted between services which have no spare capacity to assist them.
5 The workforce and service users experience major strain
The community sector’s lack of capacity to meet all demands for assistance is the result of inadequate long-term sectoral investment by different governments, and the absence of impactful and sustained measures to reduce poverty, exacerbated by three years of major economic and social disruption caused by disasters and the pandemic.
[perfectpullquote align=”full” bordertop=”false” cite=”” link=”” color=”#446681″ class=”” size=”12″]”As a peak body we do not provide direct services but the level of need for our members increased and we had to try to access sufficient funds and support for the communities our members support.” (Project office, Peak body, ACT)[/perfectpullquote]
It is clear from the survey data that the community sector continues to be inadequately resourced to meet community need. Among the 300 CEOs and senior managers participating in the survey, only 1 in 8 (12%) agreed with the statement “Funding enables us to meet community demand” (Table B. 8).[11] There was no change in this figure since 2021.[12] In 2022, funding to meet demand was particularly tight in financial, legal and emergency services. Among leaders of these services, only 4% agreed that funding enables demand to be met. Agreement was similarly low in disability services (5%), housing and homelessness services (6%) and DFV and family services (7%).
5.1 Services confront difficult choices
Circumstances have taken a toll on community service organisations, and community service workers, as well as on service users and communities.
[perfectpullquote align=”full” bordertop=”false” cite=”” link=”” color=”#446681″ class=”” size=”12″]”We have had an extensive waitlist and have only been able to service triaged issues of late.” (Team leader, Disability services, SA)[/perfectpullquote]
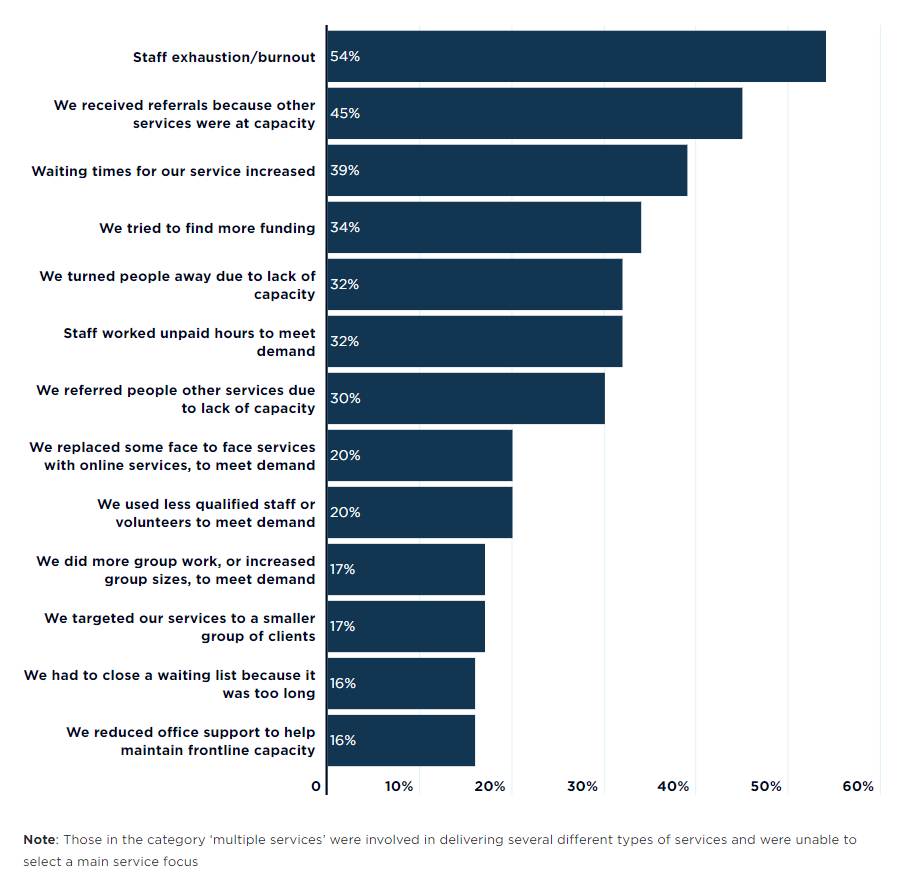
When participants were asked about the ways their service had responded to increased demand, many reported making changes that sought to minimise adverse impacts on clients and service users, such as seeking more funding (34%) or staff working additional unpaid hours (32%) (Figure 5.1).
[perfectpullquote align=”full” bordertop=”false” cite=”” link=”” color=”#446681″ class=”” size=”12″]”Trimming and targeting. Focus, and prioritize all the time. Trim again, to ensure quality. Don’t get seduced by scope creep.” (Office support, Multiple services, ACT)[/perfectpullquote]
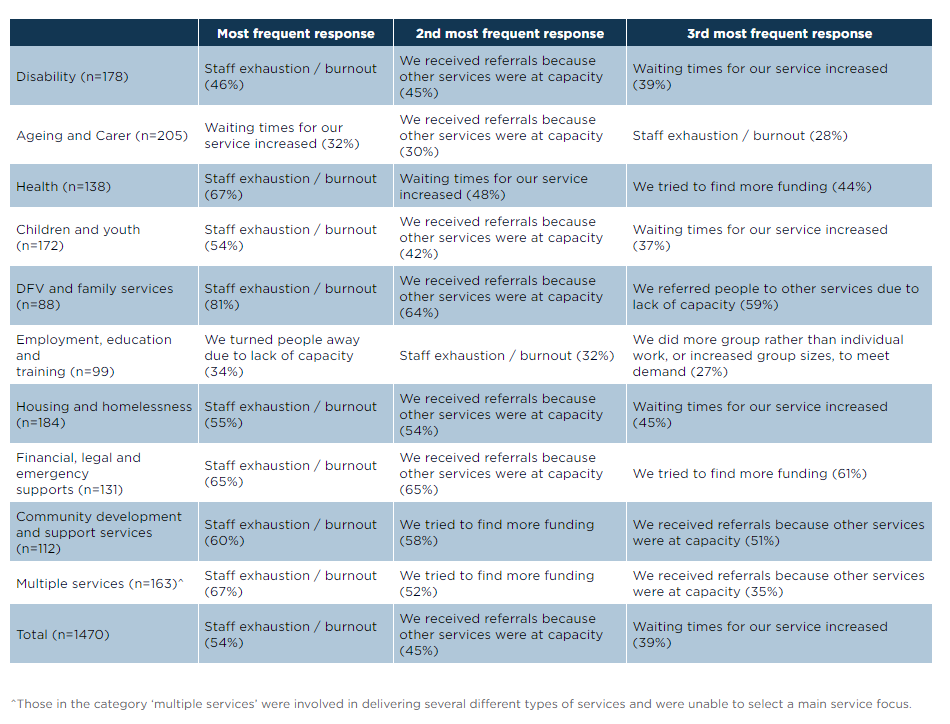
However other providers had to make tough choices about changing the service offering so that they could support as many people needing help as possible. One in five said their service had replaced face-to-face supports with online offerings to expand their capacity, and 17% attempted to meet demand by doing group rather than individual work (or increasing group sizes). One in five said they used less qualified staff or volunteers to meet demand. Across all service categories, staff exhaustion or burnout was the most commonly observed response to demand pressures (54%, Table 5.1). It was particularly high for those focused on DFV and family services (81%). The three most common responses to demand pressures for each category of service are listed in Table 5.1.
Figure 5.1 Responses to demand in participants’ main service during 2022 (n=1476)
5.2 Clients bear the brunt of declining capacity
Where services cannot meet demand, clients are inevitably affected. In ageing and carer services, the most common result of increased demand was increased waiting times (reported by 32% of participants). In employment, education and training services, the most common response was turning people away due to lack of capacity (reported by 34%).
[perfectpullquote align=”full” bordertop=”false” cite=”” link=”” color=”#446681″ class=”” size=”12″]”We are doing well to meet need, however the service has firm boundaries of what support can and can’t be provided.” (Frontline worker, Mental health service, Vic)[/perfectpullquote]
Across the sector:
- Around 2 in 5 (39%) said waiting times for their main service had increased. Increased waiting times were reported by almost half of participants focused on financial, legal and emergency supports (49%), health services (48%) and domestic and family violence (47%).
- A third (32%) said their service had turned people away due to lack of capacity. Turning people away was very common among those focused on housing and homelessness (43%) and financial, legal and emergency supports (44%)
- 16% had to close a waiting list, because it was too long.
Table 5.1 Results of demand pressure, by main service
5.3 Stretched services means stretched staff
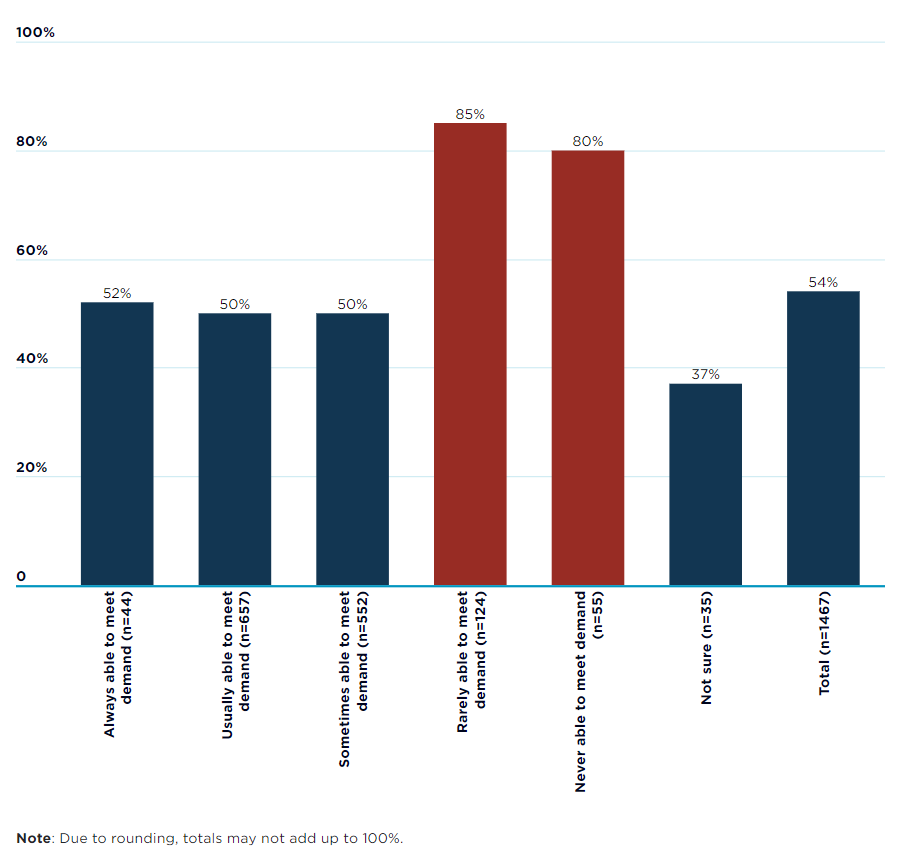
Circumstances are also taking a toll on staff. While over half of participants said staff exhaustion or burnout had occurred in their main service, this was much more common in the most stretched services. Indeed, staff exhaustion or burnout was observed by 80% to 85% of participants in services that could rarely or never meet demand, compared to around half of those in services that could at least sometimes meet demand (see Error! Not a valid bookmark self-reference.). A senior manager in a legal services provider in the Northern Territory (NT) summed up the impact on staff with just three words, ‘Everyone is exhausted.’
Figure 5.2 Proportion of participants who reported staff exhaustion or burnout in their main service, according to their capacity to meet demand
[11] The question was asked in relation to their most important stream of government funding.
[12] Cortis N and Blaxland, M (2021) Meeting demand in the shadow of the Delta outbreak: Community Sector experiences. Demand Snapshot 2021. Sydney: ACOSS. https://www.acoss.org.au/wp-content/uploads/2021/12/Demand-snapshot_ACSS-2021_v3.pdf
6 Investing in the sector’s capacity to help people
Australia’s community sector ably provides essential supports even while grappling with major structural challenges of under-investment, surging demand, rolling disasters and worker exhaustion. While the sector is innovative and resilient, its capacity has been depleted by the significant disruptions to staffing this year.
- Over half of participants (56%) reported their main service or program had been affected by staff absences due to COVID-19.
- The same proportion (56%) said difficulties keeping their main service properly staffed had increased.
- Two in five (40%) said their main service or program was unable to recruit the staff that were needed.
- 36% said they faced difficulties finding volunteers.
[perfectpullquote align=”full” bordertop=”false” cite=”” link=”” color=”#446681″ class=”” size=”12″]”Since COVID19, staffing has become the major issue – staff retainment and attracting new staff. The current staff are burnt out with little reprise in service demand and delivery. I feel we are in a reactive climate rather than proactive.” (Senior manager, Mental health service, Qld)[/perfectpullquote]
When asked to comment on their organisations’ capacity to meet demand, the majority of respondents discussed difficulties with attracting and retaining staff. They described their work as stressful and challenging, and said that when such conditions were coupled with low pay and short-term, insecure contracts, community service work struggles to employ new staff, and too often loses good staff.
[perfectpullquote align=”full” bordertop=”false” cite=”” link=”” color=”#446681″ class=”” size=”12″]”It is so difficult to recruit and retain staff and volunteers. The lure of the public service is too great in the ACT.” (CEO, Health related service, ACT)[/perfectpullquote]
[perfectpullquote align=”full” bordertop=”false” cite=”” link=”” color=”#446681″ class=”” size=”12″]”The staffing situation has become dire; the workloads and levels of risk carried by frontline workers has increased to dangerous levels. Referring families for support has become increasingly difficult, because most agencies have increasingly lengthy wait lists.” (Frontline worker, Child and youth services, WA)[/perfectpullquote]
[perfectpullquote align=”full” bordertop=”false” cite=”” link=”” color=”#446681″ class=”” size=”12″]”We have had several short-term (3 month) contracts, which makes it difficult for workers. Several in the team have simply found work at the end of contract periods.” (Frontline worker, Mental health service, Vic)[/perfectpullquote]
These challenges also exist in sectors like domestic and family violence services, where participants said some additional funding has been made available. For example, these organisational leaders described an inability to fill new positions, which impact on service delivery:
[perfectpullquote align=”full” bordertop=”false” cite=”” link=”” color=”#446681″ class=”” size=”12″]”The service has received much needed enhancement funding to expand services offered, however this then comes with the difficulty of finding suitably qualified staff to undertake this additional work.” (Board member, DFV and family service, Qld)[/perfectpullquote]
[perfectpullquote align=”full” bordertop=”false” cite=”” link=”” color=”#446681″ class=”” size=”12″]”Whilst the family violence sector in Victoria has received significant funding the last few years, we have a skills shortage and are having difficulty recruiting to the number of positions available. Obviously when we are unable to fill positions this reduces our capacity to meet service demand, resulting in wait times for clients. Despite ongoing review of demand management processes, this continues to be difficult when we are understaffed. The availability of crisis, transition and long-term housing also continues to be a huge issue for our clients. Often resulting in clients returning to perpetrators as they have nowhere else to go.” (Senior manager, DFV and family service, Vic)[/perfectpullquote]
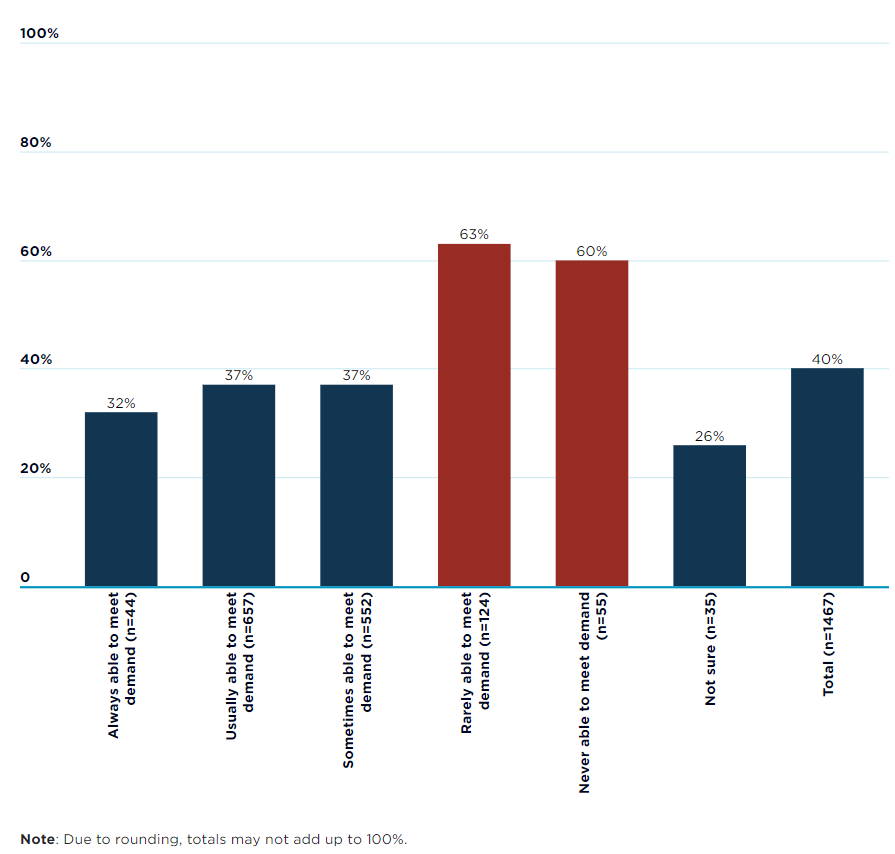
Importantly, in services struggling most to cope with demand, recruitment difficulties are disproportionately high. Whereas 32% of participants in services which were ‘always’ able to meet demand reported being unable to recruit the staff they needed, this was much higher in those ‘rarely’ or ‘never’ able to meet demand (63% and 60%) respectively. This association likely reflects that difficulties recruiting staff limit organisations from meeting demand. It also reflects that stretched services are likely to find it most difficult to attract staff due to workload pressures and work intensity. Addressing these workforce challenges, and ensuring staff are paid fairly, have job security and improved conditions, is essential to ensuring adequate capacity to meet need.
Figure 6.1 Proportion of participants whose main service could not recruit the staff they needed, by ability to meet demand
7 Conclusion
The Australian Community Sector Survey this year reveals the long-term impacts of prolonged under-investment in communities. At a time when people were navigating cost of living pressures, increased financial distress and disadvantage, ongoing disasters, and continued disruption from COVID-19, they found a service system doing its absolute best but straining to keep up.
While the sector is highly resilient, adaptive and capable of meeting successive and prolonged crises, organisations are struggling to meet the growing and intensifying needs of communities because of a steadily eroding funding base. Most services faced increased demand and few could consistently meet the high level of need in the community.
As custodians of the public interest, governments have an obligation to act constructively to achieve two main outcomes. Firstly, to ensure that community services have the necessary capacity to meet community demand for help. Secondly, to upgrade our economic and social supports to ensure that over time, fewer people need help out of desperation, disaster and despair. Government is the main actor that can ensure people access a liveable and dignified level of income support, can find social housing, and can rebuild their working lives through employment and training. In the recent past, the ACSS has revealed how key sectoral indicators worsen each year. With a reprioritising of government priorities, we could see a reversal in this report’s trends. Such a reversal would reflect Australia becoming more equal, fairer and socially cohesive, truly ensuring no one is left behind or held back.
A further report, detailing the full experience of the community sector across major indicators including contracting and funding, will be released in early 2023.
Appendix A: Survey methods and participants
Material in this report comes from the Australia Community Sector Survey, an initiative of ACOSS conducted in partnership with the COSS network and the Social Policy Research Centre. With the assistance of the Australian Council of Social Service and the State and Territory Councils of Social Service, the survey was designed to capture information based on the experiences and perspectives of community sector staff and leaders (i.e. CEOs and senior managers). Data was collected online via Qualtrics between September 5th and October 7th, 2022.
The research was approved by UNSW Sydney Human Research Ethics Committee (HC220506).
As there is no comprehensive national list of all relevant community sector organisations or staff from which to draw a representative sample, the team sought to reach respondents via COSS members, peak bodies, the Australian Services Union, websites and relevant social media, to ensure the widest possible reach. The COSS network were asked to share the survey with organisations in their network, and to distribute the link to staff. In addition, the survey was sent to 672 workers who provided their email address when completing the previous year’s ACSS, for the purposes of being informed about future surveys. In addition, we sought to encourage participation by offering an incentive in the form of an opportunity to go into the draw to win shopping vouchers.
In total, 1476 community sector workers participated. As not all answered every question, responses are lower on some indicators. A separate module of questions was asked of organisational leaders only (CEOs and senior managers). These questions for leaders related to issues for the service overall, such as funding, indexation, and recruitment and retention. Further findings based on these topics will be reported in 2023.
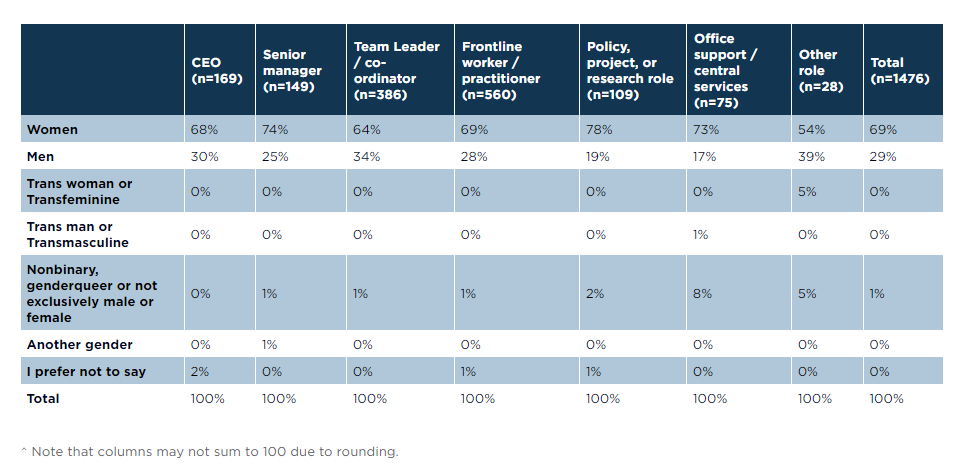
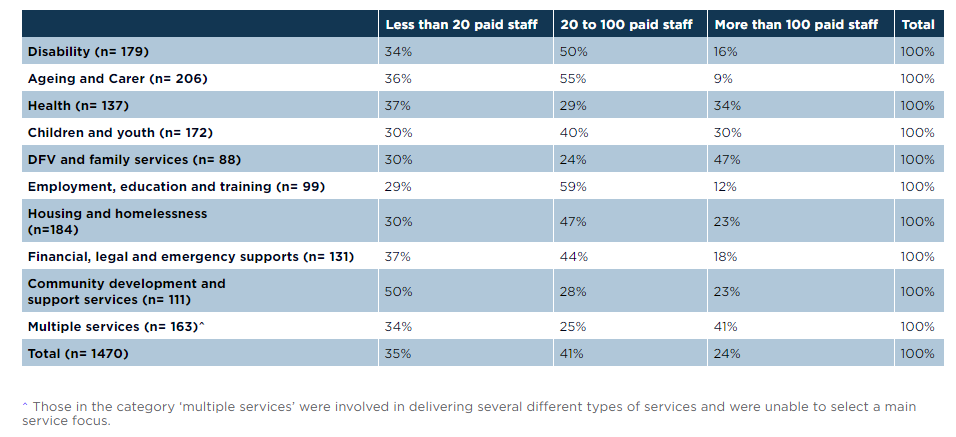
Response analysis, profiling key characteristics of participants, is in Table A.1, Table A. 2 and Table A. 3.
